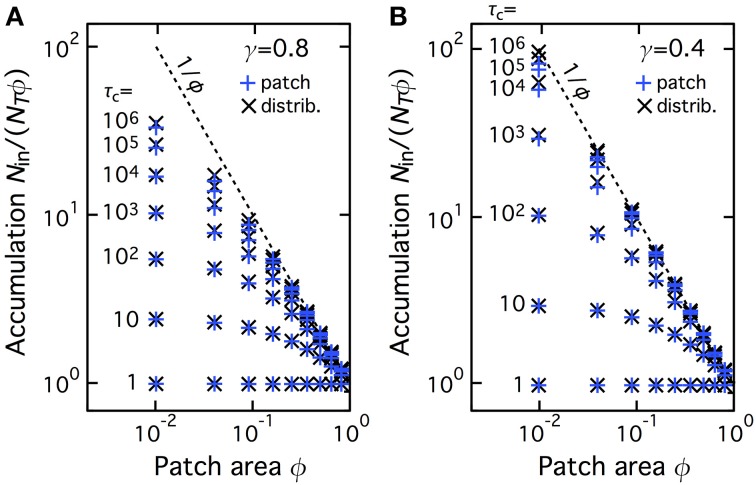
Figure 4.
The accumulation phenomenon with NHC is not specific of the central patch geometry. Accumulation values are shown for simulations of NHC with a single central CTRW patch (i.e., the geometry used in Figure 3, blue plus signs, “patch” configuration) and when the patch is split into many smaller subparts, that are spread uniformly in the space domain (“distributed” configuration, black crosses). See the main text for details. All the other parameters and symbols are identical to Figure 3, in particular the anomalous exponent γ was 0.8 (A) or 0.4 (B).

