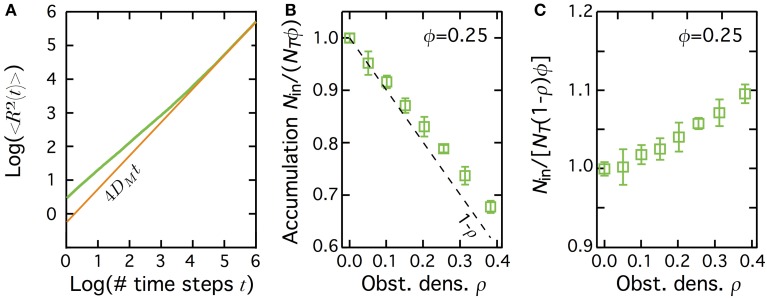
Figure 5.
Diffusion hindering by obstacles leads to depletion of the molecules in the patch at equilibrium. (A) The mean square displacement 〈R2〉 in transient subdiffusion due to hinderance by randomly-located immobile obstacles (green curve) first scales as tγ (with γ<1), before converging to a Brownian motion with DM a (macroscopic) diffusion coefficient, i.e., 〈R2〉 = 4DMt (brown curve). Obstacle density ρ = 0.35, patch area fraction ϕ = 1. (B) When the obstacles are restricted to a central patch, the number of molecules inside the patch at equilibrium decreases below 1.0, Nin/(NTϕ) ≤ 1.0 (depletion). The dashed line shows Nin/(NTϕ) = 1 − ρ. (C) When accumulation is computed using the effectively accessible area in the patch (1 − ρ)ϕ, and not the total patch area ϕ, one gets instead a weak accumulation in the patch. In (B,C), bars indicate ± 1 s.d., and the fraction area of the patch ϕ = 0.25.

