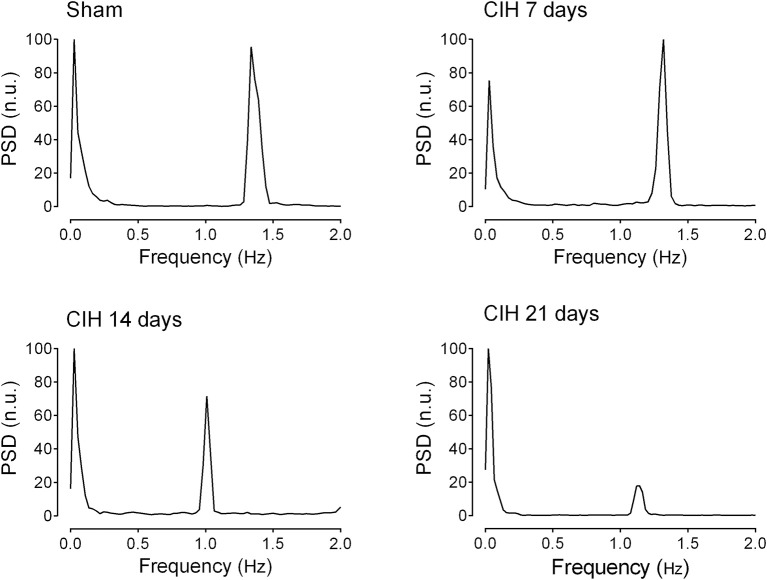
Figure 4.
Representative traces of the power spectral density of heart rate variability in one sham rat (Sham), one rat exposed to CIH for 7 days (CIH 7), one rat exposed to CIH for 14 days (CIH 14) and one rat exposed to CIH for 21 days (CIH 21). PSD, Power spectral density expressed in normalized units (n.u.).

