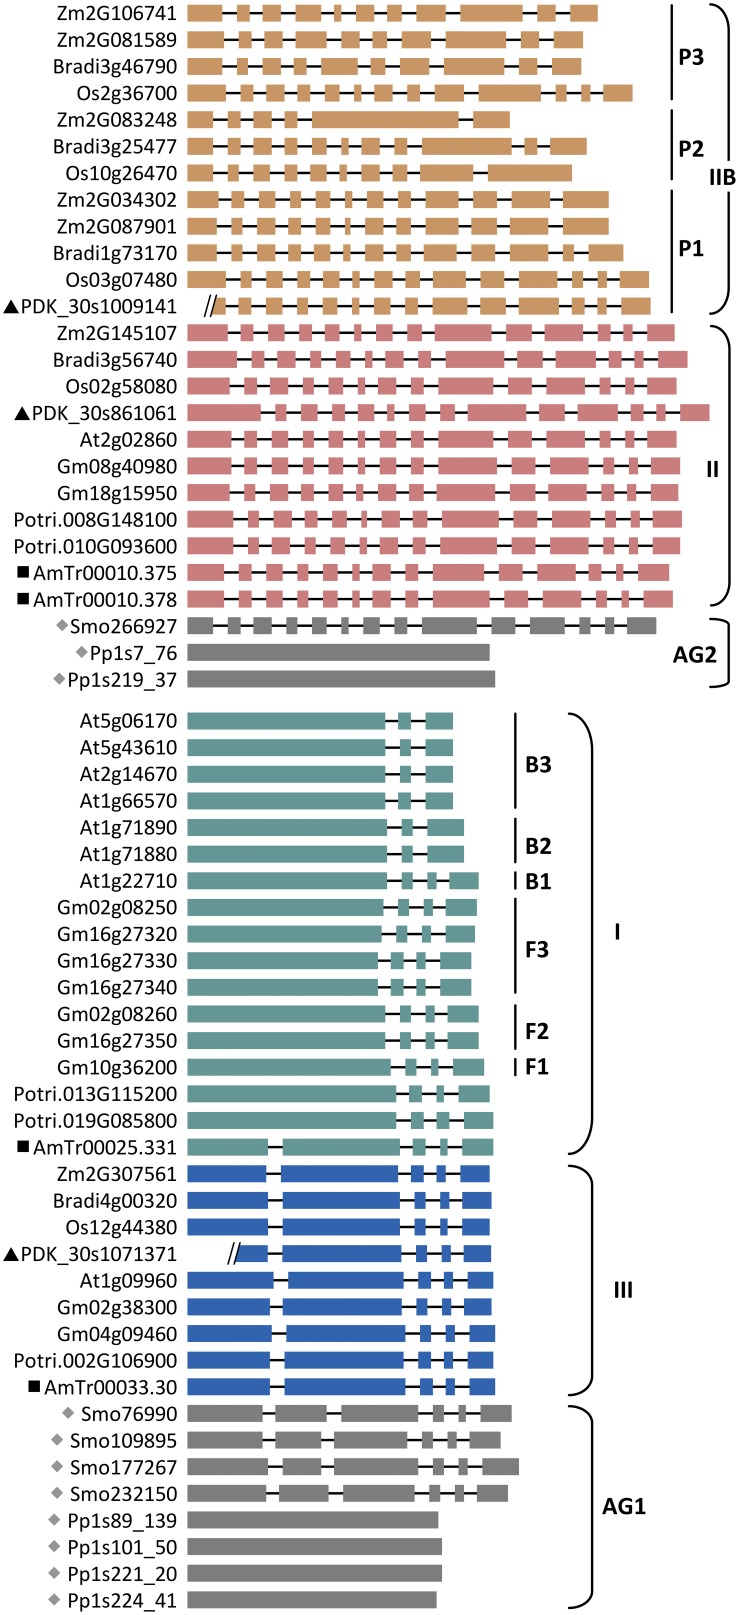
Figure 3.
Exon-intron structure of SUT genes in representative species arranged by SUT groups. Ancient groups (AG1-AG2), Type I subclades of Brassicaceae (B1 to B3) and Fabeceae (F1 to F3), and Type IIB subclades of Poaceae (P1 to P3) are indicated. Basal lineages are denoted by solid symbols (gray diamonds, Physcomitrella (Pp) and Selaginella (Smo); black squares, Amborella (AmTr); black triangles, Phoenix (PDK). Introns are not drawn to scale, and two Phoenix gene models contain sequence gaps within the first exon. Other taxa are: Arabidopsis (At), Brachypodium (Bradi), Glycine (Gm), Oryza (Os), Populus (Potri), and Zea (Zm).

