
Figure 1.
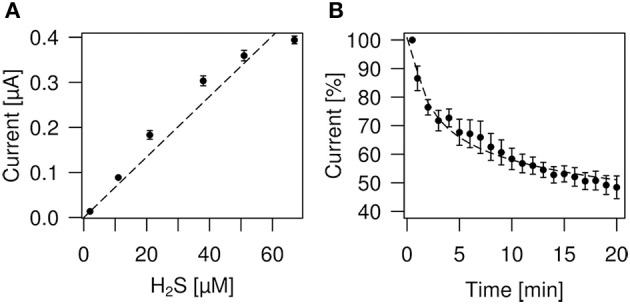
Determination of H2S concentrations and loss of H2S by evaporation. (A) Plot of the H2S concentrations derived from NaHS donor vs. H2S sensor current (nA). The relationship is linear up to about 50 μM H2S, respectively 226 μM NaHS (stippled line fitted to data points). (B) Measurement of H2S evaporation from physiological bath solution. The plot shows sensor current readings vs. time. One hundred percent indicates the beginning of the measurement which started immediately after preparation of the solution.