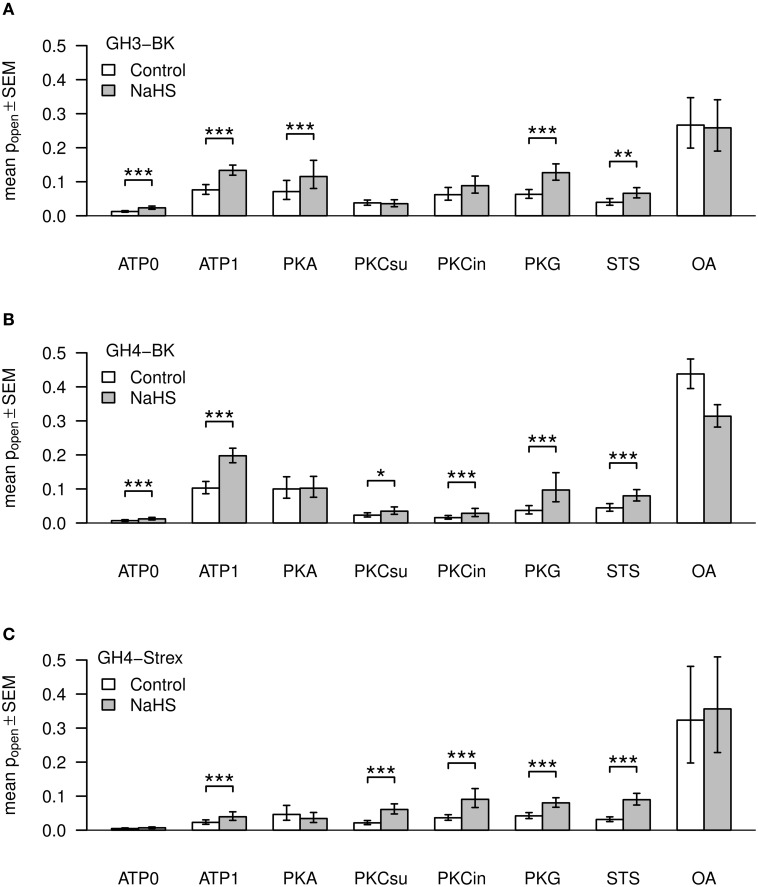
Figure 3.
Mean values of BK channel open time probabilities (Popen). Three types of channels, GH3-BK (A), GH4-BK (B), and GH4-STREX (C) cells, were investigated. Bar graphs show Po-values under control conditions (left bars, white) and after extracellular application of NaHS (right bars, gray). ATP, kinase, kinase inhibitor, kinase inhibitor staurosporine (STS), or phosphatase blocker okadaic acid (OA) were added to the pipette solution; ATP0 – no ATP added; ATP1 – 1 mM ATP added; PKA (50 units); PKCsu (0.1 units/ml); PKCin – 500 nM; STS – 1 μM; OA – 100 nM. Figures are based on back transformed means and s.e.m. values (error bars), respectively. Asteriks indicate significance of H2S (300 μM NaHS equivalent to effective 34–41 μM H2S) effects according to the logit transformed data.

