Figure 2.
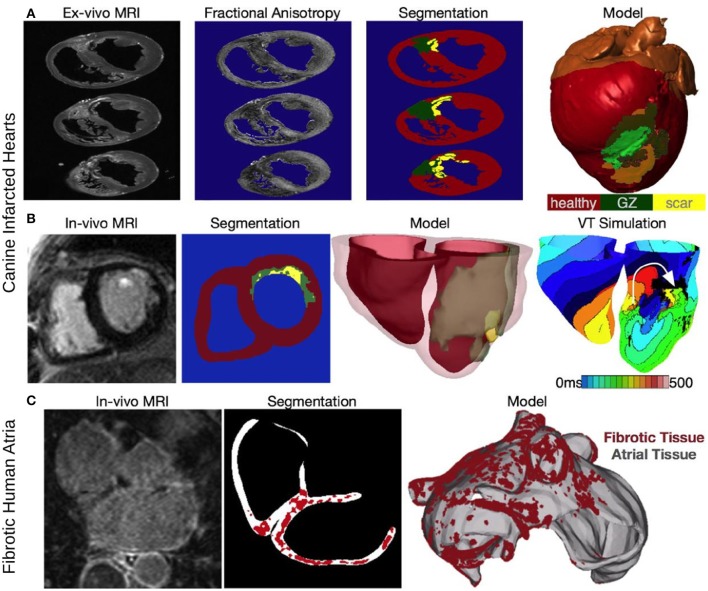
Constructing image-based models of the ventricles from an infarcted canine heart (A,B) and the fibrotic atria of a human patient with AF. (A) Reconstruction from an ex-vivo MRI scan of an infarcted canine heart. Fractional anisotropy (FA) maps as calculated from the DT-MRI, brighter color corresponds with higher FA value. The images are segmented into healthy myocardium, gray zone (GZ), and scar, to reconstruct an image-based model of the infracted canine heart (right-most panel). Modified with permission from Arevalo et al. (2013). (B) Construction of a patient-specific ventricular model of arrhythmia from a clinical MR scan. Shown are images of an infarcted patient heart before ablation (treatment) and the corresponding segmentation: healthy (red), GZ (green), or scar (yellow). An image of the three-dimensional geometric model of the patient heart rendered with the epicardium and the infarct border zone semitransparent is shown in the third panel. The right-most panel presents in silico activation map of arrhythmia, revealing reentry on the left ventricular endocardium. The color code in the bottom right shows electrical activation time. Modified with permission from Winslow et al. (2012). (C) A model of the fibrotic human atria generated from a patient LGE-MRI scan (top left) following segmentation (top right) into normal and fibrotic tissue (fibrotic lesions in red). With permission from McDowell et al. (2012).

