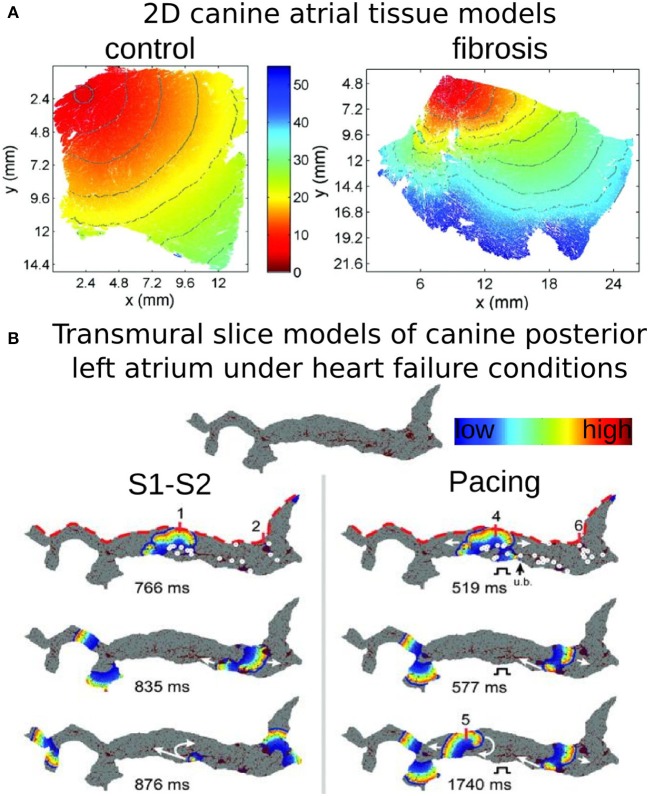
Figure 3.
Modeling fibrosis as regions of collagen presence. Collagen is represented as an insulator. (A) Simulations of propagation in models of 2D tissue sections of canine atrium (control, left, and fibrosis, right). With permission from Burstein et al. (2009). (B) Simulations in models of a transmural slice of canine posterior LA under HF conditions; the top of the slice (red dashed lines) corresponds to the epicardial surface. Snapshots at several timeframes for cross-field stimulation (left), and pacing at a frequency of 6 Hz (right), as well as endocardial time-space plots. Colors indicate transmembrane voltage from low (blue) to high (red). The site of unidirectional block (ub). is indicated by a black arrow. White circles on the upper voltage maps indicate sites of wavebreak. With permission from Tanaka et al. (2007).

