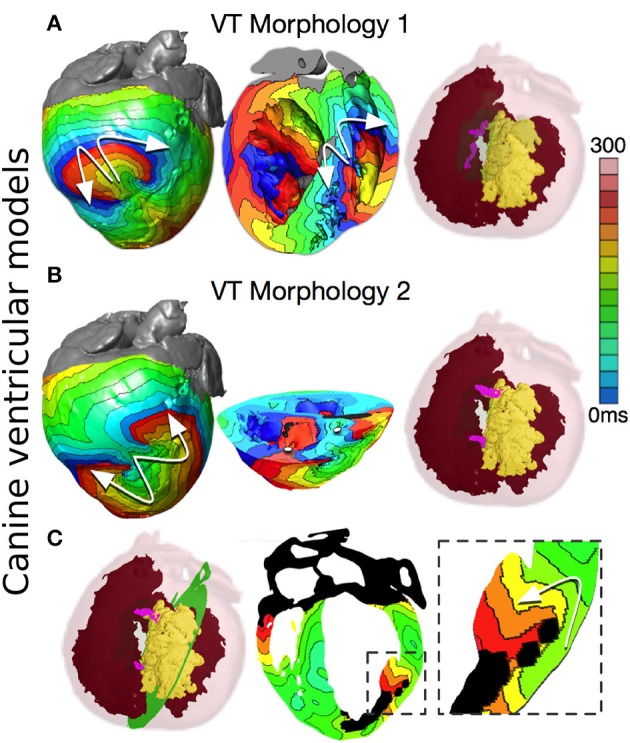
Figure 5.

Reentry morphologies during post-infarction ventricular tachycardia (VT) in a canine cardiac model. (A) VT morphology 1: Activation maps on the epicardium and in a long-axis cross-section of the ventricles, revealing figure-of-eight reentries on the epicardium, and on the right ventricular (RV) endocardium. VT is sustained by two I-type filaments (pink lines) located within the GZ with endpoints on the epicardium and RV endocardium. (Red: endocardial and epicardial surfaces, Yellow: scar surface, semi-transparent green: GZ) (B) VT morphology 2: Activation maps on the epicardium and in a short-axis cross-section of the ventricles, revealing figure-of-eight reentry on the epicardium, and two breakthroughs on endocardium (white dots). Reentry was organized around two I-type filaments with endpoints on the epicardium and scar (pink lines). (C) Activation map showing an apparent reentry around a scar distal from filaments. The overall VT morphology is similar to VT morphology 2 in Panel B. With permission from Arevalo et al. (2013).
