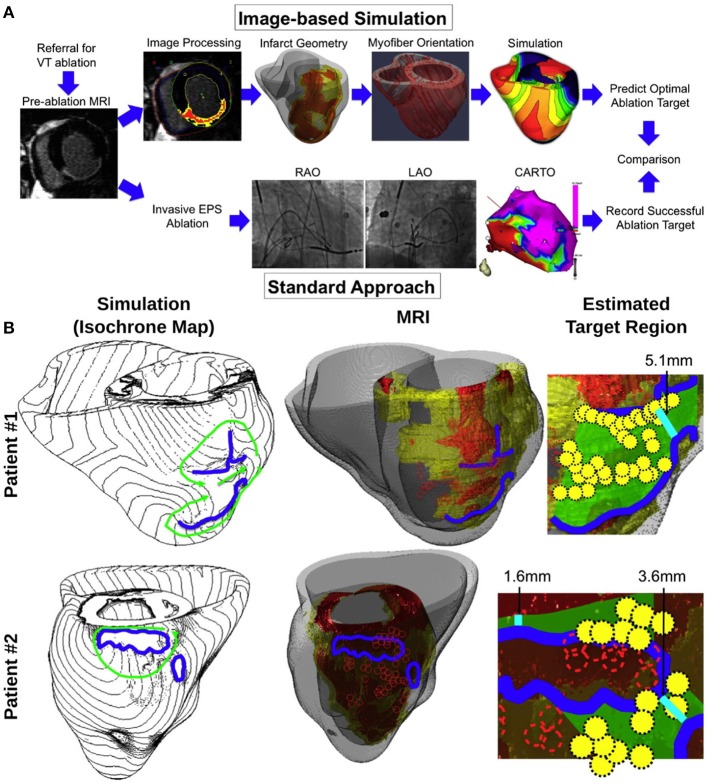
Figure 6.
(A) Proposed simulation-guided approach for determining the ablation targets of infarct-related ventricular tachycardia. The patients referred for ventricular tachycardia (VT) ablation undergo pre-ablation MRI, which was processed to provide the heart and infarct geometry (scar: red; GZ: yellow). These geometrical data were incorporated into a model of VT to estimate potential target regions. This method is alternative to an invasive electrophysiology study (EPS), and ablation [“Standard Approach”; by using biplane X-ray fluoroscopy and electroanatomical mapping (CARTO)]. LAO—left anterior oblique; RAO—right anterior oblique. (B) Comparison between simulation-guided and standard electrophysiological approaches for identifying endocardial ablation targets in two patients with infarct-related ventricular tachycardias (VTs). Left column: propagation pathways (green) and lines of conduction block (blue) are overlaid over VT activation maps simulated in image-based patient heart models. Middle column: preablation infarct geometry (infarct scar: orange, border zone: yellow, and non-infarcted: gray) along with ablation lesions delivered by the standard approach (red circles), and conduction block lines as calculated from ventricular simulations. Right column: optimal ablation zones (green shading) predicted by simulations, with narrowest isthmuses indicated (cyan); in both cases, only a fraction of the ablation sites from the standard approach were within the predicted optimal LV endocardial ablation zone (yellow circles). Modified with permission from Ashikaga et al. (2013).

