
Figure 5.
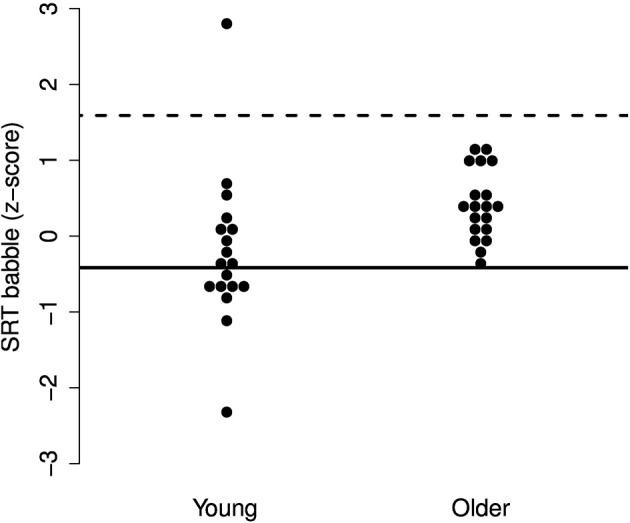
Individual z-scores for the SRTs in two-talker babble. The solid line indicates the mean for the young adults and the dotted line indicates the deviance threshold (1.65 SD above the mean for the young adults). No deviant older adults were identified.