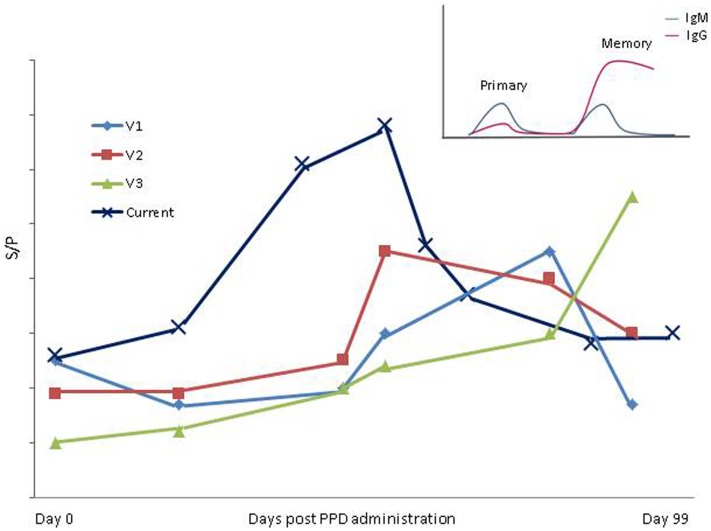
Figure 4.
Variation in period of influence of SICCT in present study compared to Varges et al. (21) is shown. V1–V3; Approximate S/P results of positive cows identified using “in- house” ELISA by Varges et al. (21). Current; mean ELISA S/P results from entire herd in the present study. Insert; a schematic of primary and secondary/memory immune response [adapted from Tizard (25)].

