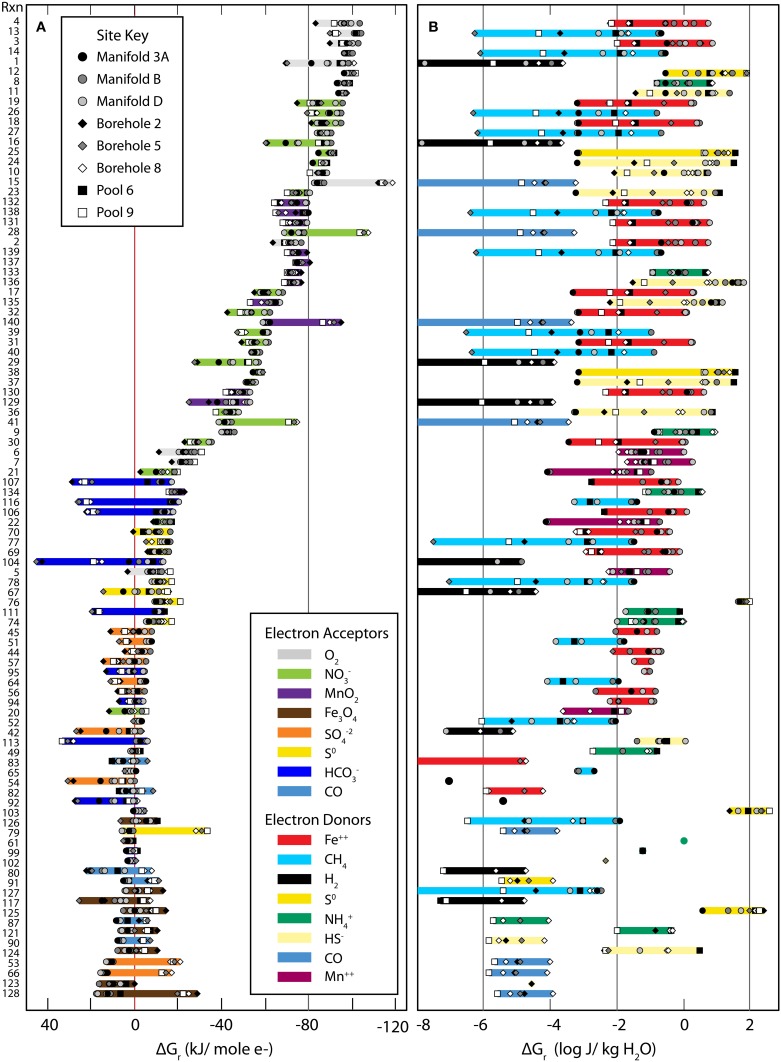
Figure 2.
Gibbs Energy yields from all reactions considered in this study (see Table 1). Gibbs energies of the reactions listed in Table 1 referenced by the numbers on the far left side. The small gray-scale symbols refer to values of ΔGr calculated at individual sites. The left hand panel (A) shows Gibbs energies in units of kJ per mole of electron transferred, kJ (mol e−)−1. The range of ΔGr values is highlighted by bands whose color corresponds to the electron acceptor in the reactions. The right hand panel (B) shows Gibbs energies of reaction as energy densities, Joules per kg of water, J (kg H2O)−1. The highlighted bars are color coordinated with the electron donor in the reactions.

