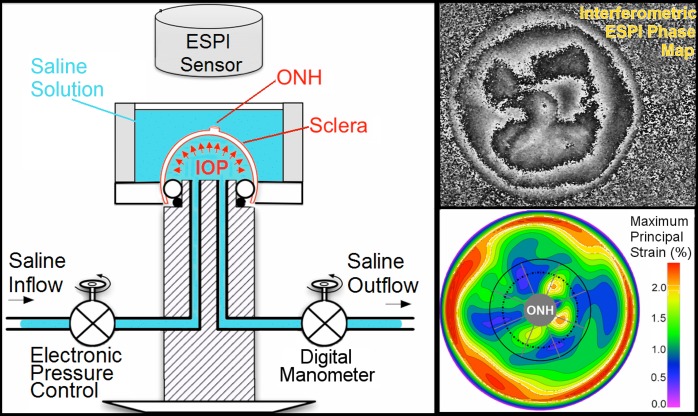
Figure 1.
Left: Diagram of the inflation testing apparatus. Right, top: A typical correlation fringe pattern representing the laser waveform phase variation measured by the ESPI. Right, bottom: A typical maximum principal strain map of the outer surface of the sclera. The boundaries of the peripapillary and midperipheral regions surrounding the ONH are shown by the solid and dashed lines on the lower right plot, respectively, and the boundaries of the 45°-wide sectors are shown with radial gray lines.

