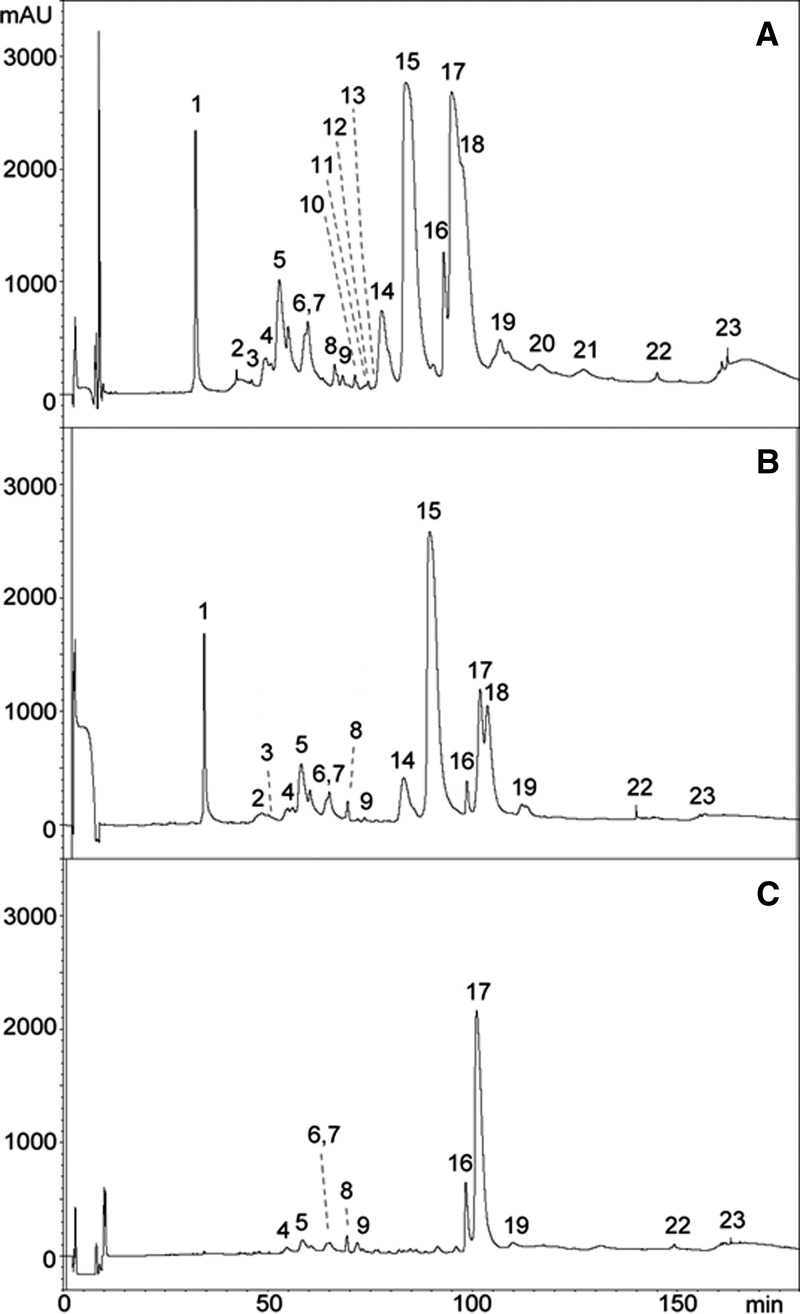
Figure 2.
Antivenomics analysis of polyspecific CSL taipan antivenom with the venom of O. scutellatus from PNG. Chromatograms represent (A) reverse-phase HPLC separations of venom proteins, (B) venom proteins immunocaptured by the affinity column, and (C) venom proteins not immunocaptured in the column (details in Materials and Methods). The identification of proteins in each peak is depicted in Table 1 based on the proteomic characterization described in a previous study.14

