
Figure 1.
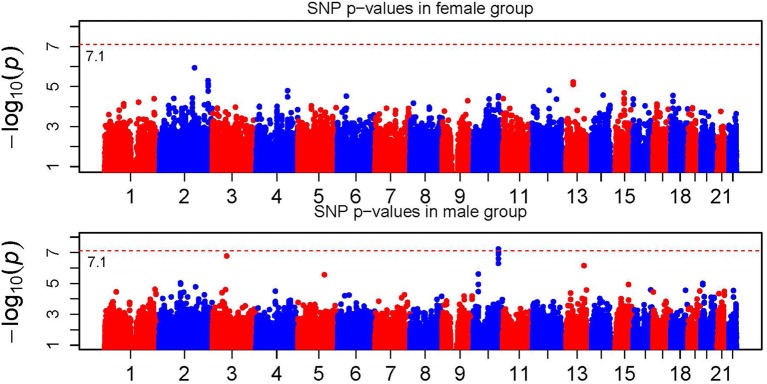
Manhattan plot of single SNP p-values. The horizontal dotted line represents the genome-wide significance threshold which is labeled in the figure.
Official websites use .gov
A
.gov website belongs to an official
government organization in the United States.
Secure .gov websites use HTTPS
A lock (
) or https:// means you've safely
connected to the .gov website. Share sensitive
information only on official, secure websites.
Manhattan plot of single SNP p-values. The horizontal dotted line represents the genome-wide significance threshold which is labeled in the figure.