Figure 3.

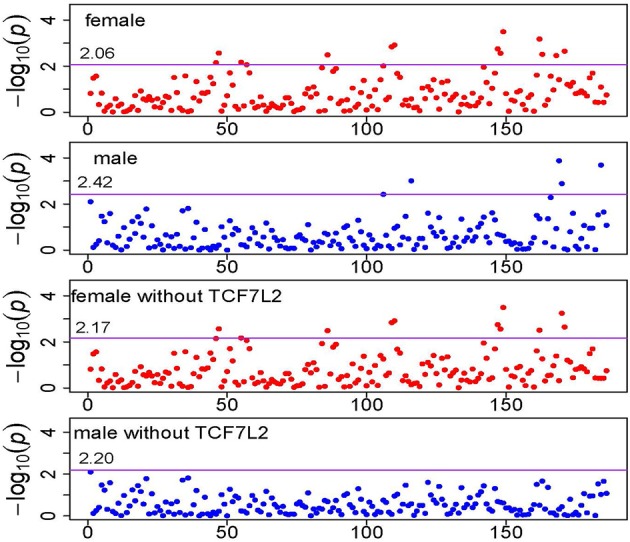
Manhattan plot of KEGG pathway p-values. The horizontal solid line represents the genome-wide pathway level significance threshold which is labeled in the figure.

Manhattan plot of KEGG pathway p-values. The horizontal solid line represents the genome-wide pathway level significance threshold which is labeled in the figure.