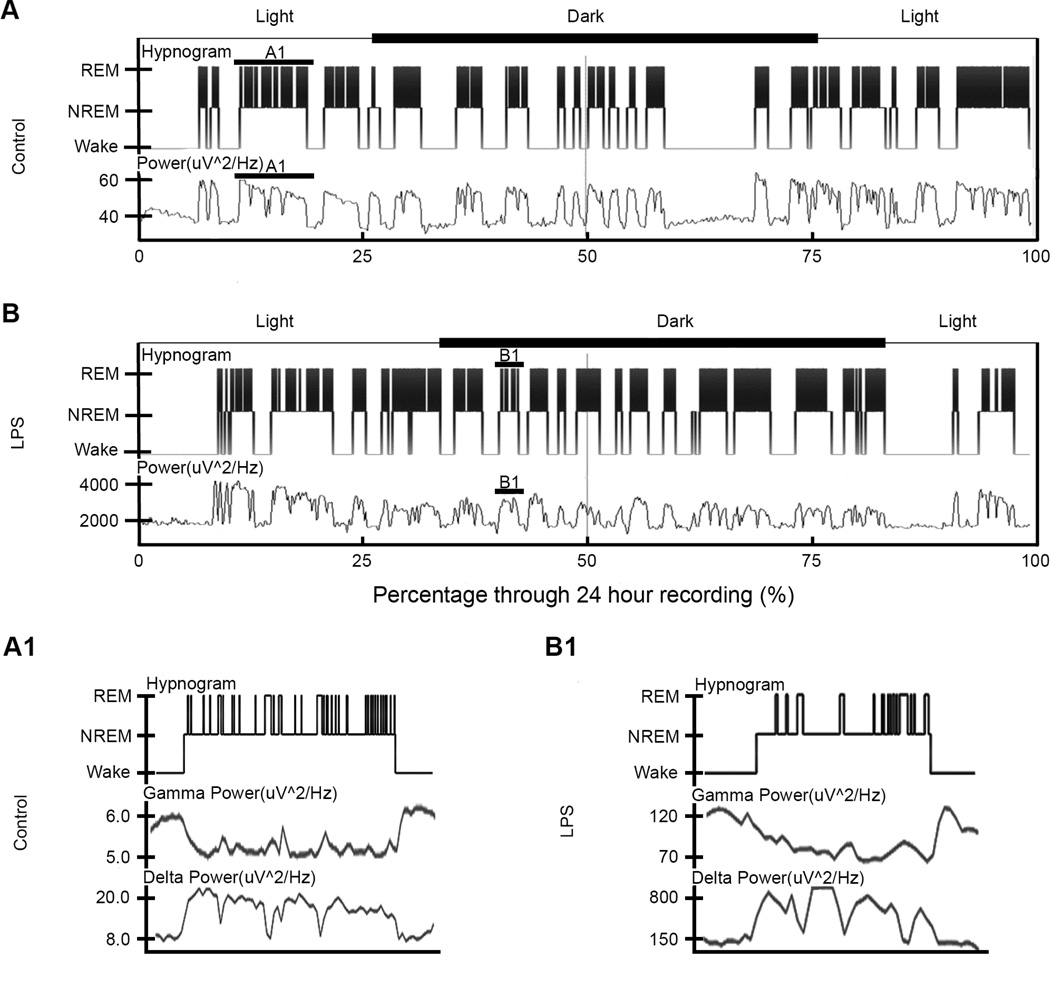
Figure 2. Hypnogram and power for control and LPS mouse over 24-hour period.
(A) and (B) The hypnogram (top) and full EEG power spectrum (bottom) for one control and LPS mouse respectively as a graph of sleep state vs. percentage through recording. All power data is in units of uV^2/Hz. The y-axis depicted wake and sleep states for the power spectrum of each mouse, while the hypnogram is split into wake, NREM and REM cycles. In addition, the axes above the hypnograms showed the timing of light and dark cycles during the recordings for each mouse. For both the control and LPS mice, a solid line highlighted one sleep cycle. These sleep cycles were enlarged in (A1) and (B1) corresponding to control and LPS respectively. The expansion showed the multiple REM cycles on the hypnograms per sleep cycle. Below the hypnograms was an example of the gamma and delta power during that respective sleep cycle. Note the downward u-shape for the gamma power and the opposite shape for the delta power during the cycle.

