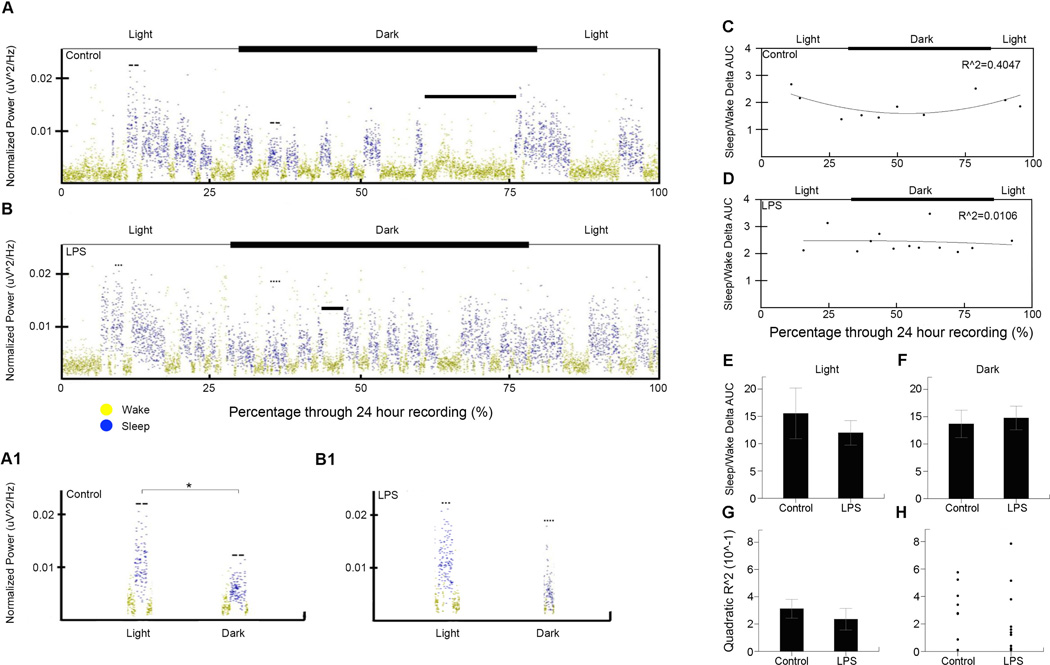
Figure 4. Delta power sleep/wake transition area under the curve (AUC) analysis.
(A) and (B) the delta power vs. recording duration for a control and LPS mouse respectively. In addition, the axes above the delta power show the timing of light and dark cycles during the recordings for each mouse. Solid bars mark the nesting cycles of each mouse. (A1) and (B1) example sleep cycles from the light and dark cycles for a control and LPS mice respectively. The greater significance (*) is marked in (A1) reflecting the quadratic trend of control delta power over the circadian cycle. (C) and (D) Plot of sleep/wake delta power AUC ratios vs. percentage through recording for one control and LPS mouse respectively with fitted quadratic curve and R^2 value (control=0.40, LPS=0.01). Each point represents the ratio between the delta power AUC from the first ten minutes of sleep, and the previous ten minutes of wake. In addition, the axes above the hypnograms show the timing of light and dark cycles during the recordings for each mouse. (E) The ratio of sleep/wake delta power area under the curve (AUC) during ten-minute sleep, wake transition windows (ten-minute wake and ten-minute sleep) for the light cycle with controls (16±5) compared to LPS (12±2). (F) The ratio of sleep/wake delta power AUC during ten-minute transition windows for the dark cycle with controls (14±3) compared to LPS (15±2). (G) The quadratic coefficient of determination (R^2) for the sleep/wake AUC ratios for control (0.35±0.079) and LPS (0.23±0.079) mice. (H) Scatter plot showing spread of quadratic R^2 values for all control and LPS mice

