
Figure 3. Patterns of cell death.
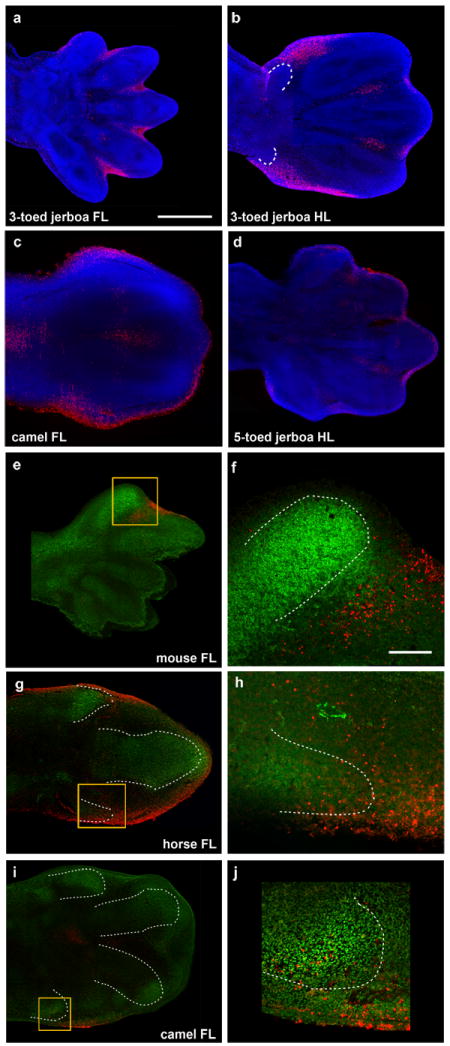
DAPI (blue), Sox9 IHC (green), TUNEL (red). a, approximately 13.5 dpc three-toed jerboa, D sagitta, fore limb; b, approximately 13.5 dpc D sagitta hind limb (white dashed line indicates truncated metatarsals I and V); c, 45 dpc camel fore limb; d, approximately 13.5 dpc five-toed jerboa, A elater, hind limb e, mouse E13.5 with Sox9 and TUNEL; f, magnification of boxed region in (e); g, 34 dpc horse fore limb; h, magnification of boxed region in (g); i, 42 dpc camel fore limb; j, magnification of boxed region in (i). Scalebar in (a) = 0.5 mm for a-d, e, g, and i. Scalebar in (f) = 0.1 mm for f, h, and j.