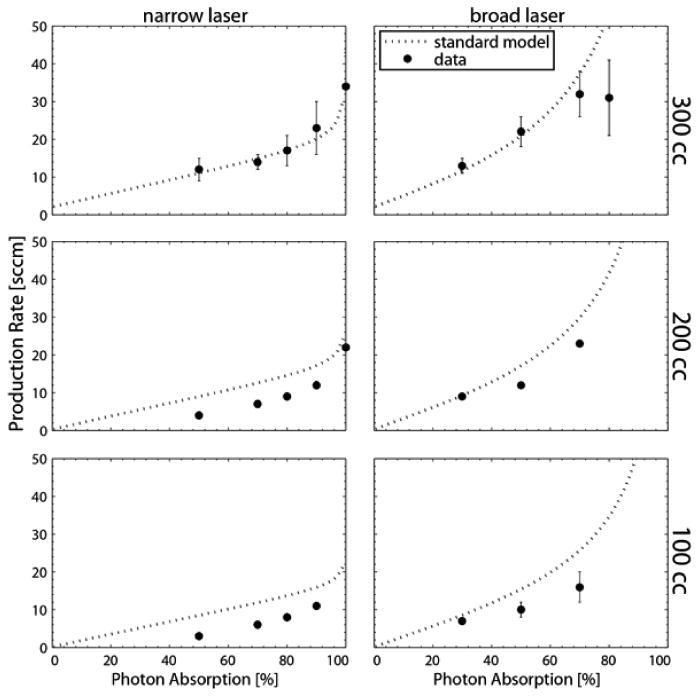
Figure 4.

Critical flow rates extracted from fitting the same flow curves as used to obtain peak polarization depicted in Fig. 3. These values are compared to predictions of the standard SEOP model and show significant underproduction, particularly for the smaller cells and high absorption.
