
Figure 9.
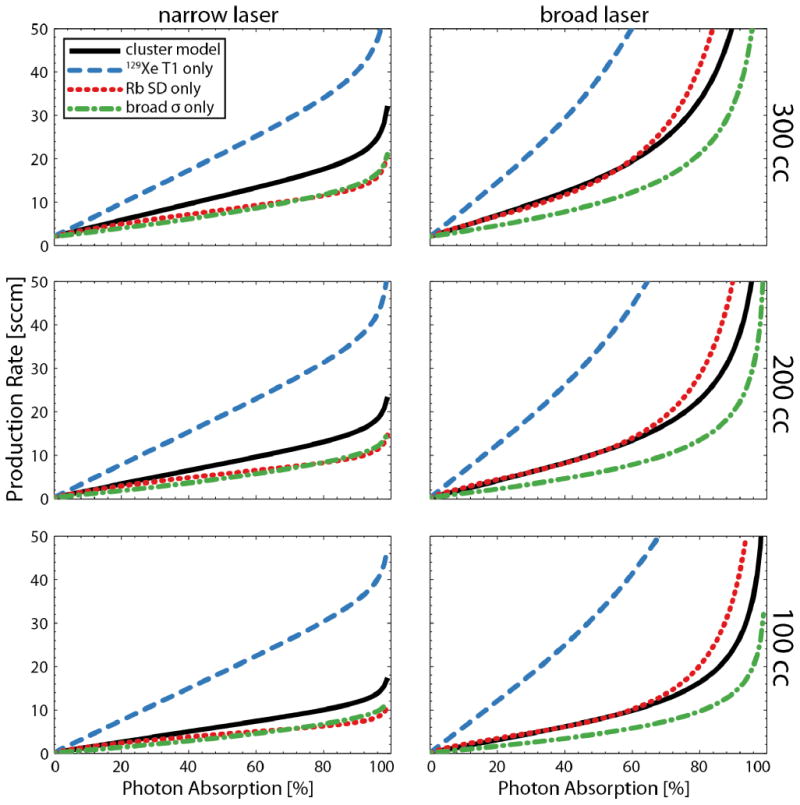
(Color online) 129Xe production rates from Figure 7, but now including predictions of the individual effects of the model, 129Xe T1 relaxation (blue), Rb spin destruction (red) and broad photon absorption (green) as compared to the full cluster model (black).