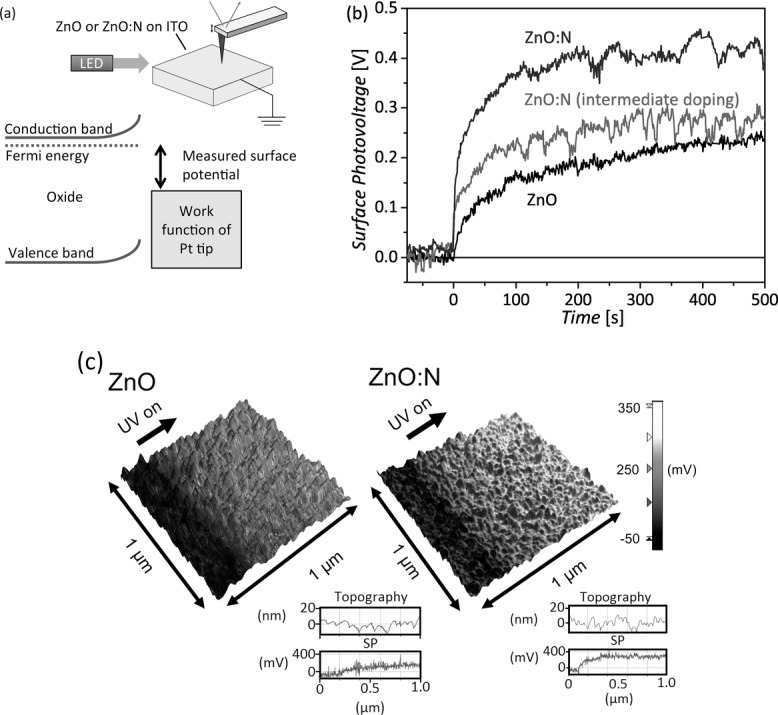
Figure 3.

a) Schematic of the time-resolved microscopic surface photovoltage measurement and the corresponding energy level diagram. Greater trapping of electrons on the surface of the oxide is expected to increase the work function of the oxide surface and decrease the measured surface potential. b) Change in surface potential measured for ZnO, ZnO:N, and ZnO:N (intermediate doping with 10% NH3) upon UV illumination. c) Surface potential measurements of ZnO and ZnO:N samples superimposed on the corresponding surface topography measurement, with the position indicated where UV illumination was turned on.
