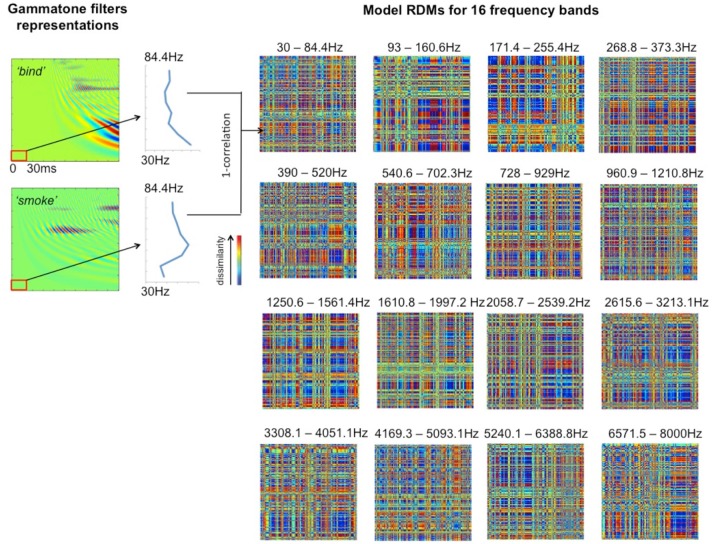
Figure 3.
Model RDMs for 16 frequency bands (right hand panels), based on the first 30 ms from stimulus onset, and representing the pairwise correlations between the 400 stimulus words in a 400 × 400 matrix. The left hand panels show two illustrative cochleagrams (see Figure 2), sampled at the lowest frequency band over the given time window. The vertical blue lines indicate the frequency characteristic curve for each word for the band indicated.

