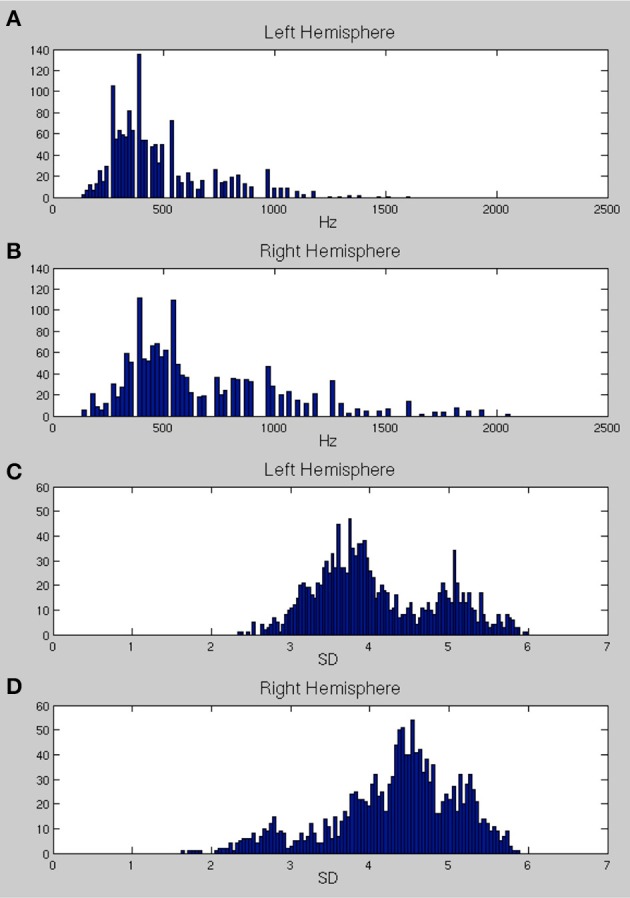
Figure 6.

(A,B) The distribution of center frequencies (in Hz) for all vertices in bilateral superior temporal cortex (A, left hemisphere and B, right hemisphere). (C,D) The distributions of the standard deviation (SD) of the Gaussian tuning curve, expressed in frequency band units, for all vertices in bilateral temporal cortex (C, left; D, right).
