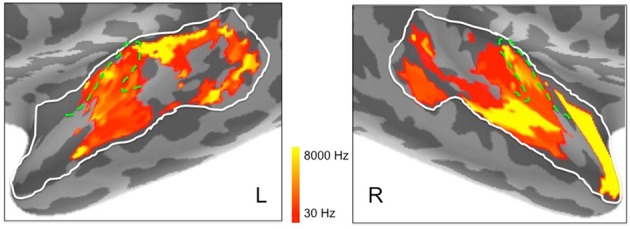
Figure 8.

Peak frequencies in left and right hemisphere superior temporal cortex derived from ssRSA analysis of EMEG data plotted in logarithmic scale in order to accommodate the full frequency range. Dashed green lines show the outlines of Heschl's gyrus (HG).
