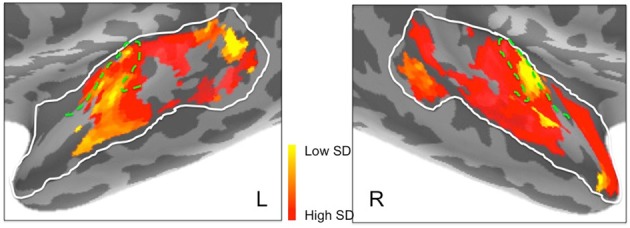
Figure 9.

Frequency selectivity in left and right hemisphere superior temporal cortex. Areas in yellow, with low standard deviation (SD), represent brain regions that are selective to a narrower band of frequencies. Dashed green lines show the outlines of Heschl's gyrus.
