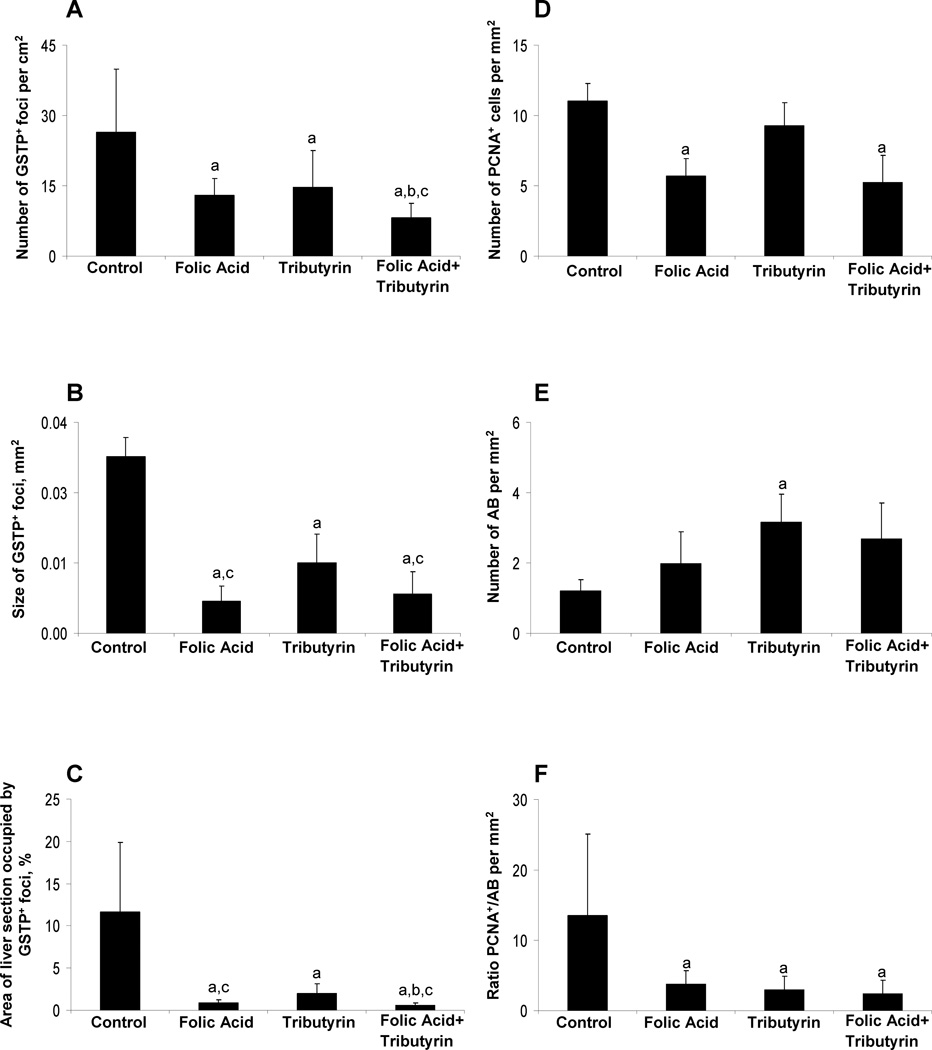
Figure 2. Histopathological changes in the in the livers of control rats and rats treated with folic acid, tributyrin, or the combination of folic acid and tributyrin.
(A) Morphometric analysis of GSTP-positive foci in the livers. The numbers of GSTP-positive foci were evaluated in liver sections using a two-dimensional approach. The data are presented as an average number of foci per cm2 of the liver. (B) Cell proliferation and apoptotic cell death in the livers. PCNA-positive cells and apoptotic bodies (AB) were counted as described in “Material and methods” and labeling indices were expressed per mm2 of the liver. a - Significantly different from control rats; b –significantly different from rats treated with folic acid only; c – significantly different from rats treated with tributyrin only; n = 7, means ± S.D.

