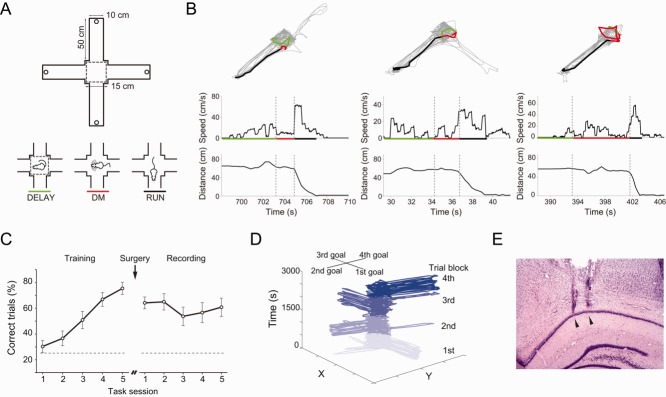
Fig 1.

Experimental design. A: (Top) Schematic representation of the four-arm maze. Dashed lines mark the central area of the maze where rats stay during intertrial intervals; each trial starts after the removal of the central barriers. Circles at the end of each arm denote reward positions; only one position was rewarded per block of 10 trials (METHODS section). (Bottom) Schematic representation of the intertrial interval (DELAY), DM, and RUN periods. B: (Top) Thin gray lines show locomotion trajectories during three representative 10-trial blocks. Thick lines represent the trajectories for DELAY (green), DM (red), and RUN (black) during a single trial. (Bottom) Locomotion speed and distance to reward location for the single trial highlighted in the top panels. Horizontal segments indicate DELAY, DM, and RUN periods colored as above. C: Task performance before (“Training”) and after (“Recording”) surgical implantation of electrodes. D: Locomotion trajectory of a trained rat across four 10-trial blocks within one recording session. Reward location changes from arm to arm at every block in a clockwise manner. Trials from different blocks are represented by different shades of blue. E: Representative cresyl-stained brain section showing glial tracks corresponding to electrodes implanted in the dorsal CA1 region; arrowheads indicate electrode tips. [Color figure can be viewed in the online issue, which is available at wileyonlinelibrary.com.]
