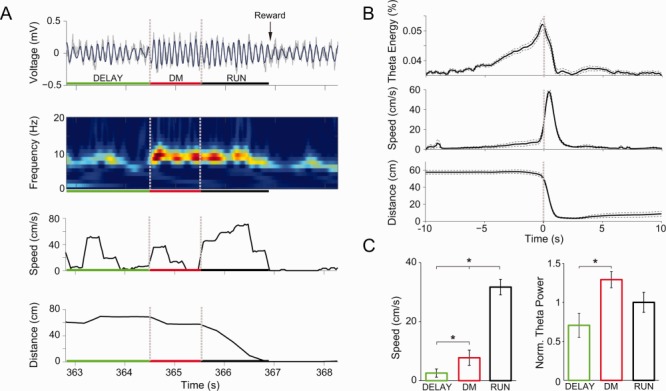
Fig 3.

Theta power increases during DM. A: (First panel) Hippocampal LFP (gray) recorded during a representative trial. Vertical dashed lines mark the moment when barriers were removed and when the animal started to move toward reward location. Horizontal green, red, and black segments indicate intertrial interval (DELAY), DM, and running (RUN) periods, respectively. Notice emergence of robust theta oscillations (5–12 Hz, blue) at the beginning of DM. (Second panel) Wavelet spectrogram showing increased theta energy during DM and RUN. (Third panel) Locomotion speed for the same representative trial. (Fourth panel) Distance from the animal to reward location. B: Group results for percentage energy in the theta band (top), locomotion speed (middle), and distance to reward location (bottom). Solid and dashed lines represent mean ± SEM, respectively (n = 5 animals). Only correct trials were taken into account. C: Mean locomotion speed (left) and normalized theta power (right) during DELAY, DM, and RUN periods. Error bars represent SEM (*P < 0.01, one-way ANOVA followed by Tukey's post hoc test; n = 5 animals). [Color figure can be viewed in the online issue, which is available at wileyonlinelibrary.com.]
