
Fig 6.
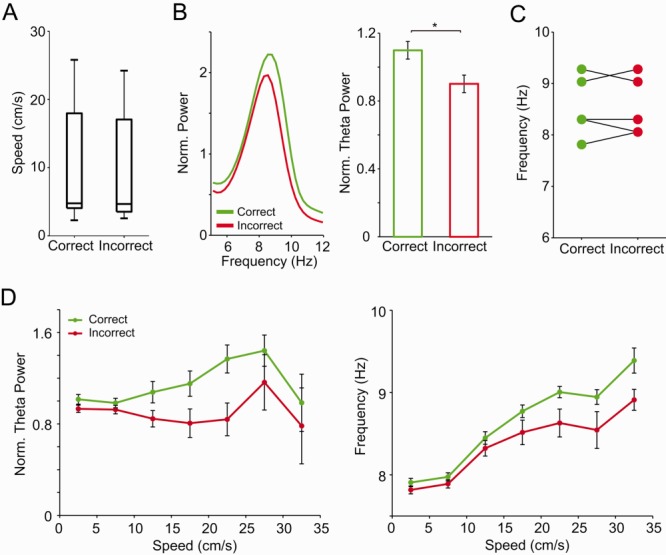
Correct choices have strongest theta power during DM. A: Speed distribution in subsets of trials used in panels B and C. B: (Left) Mean-normalized power spectra during DM previous to correct (green) and incorrect (red) choices. (Right) Normalized DM theta power (mean ± SEM across rats; *P < 0.05, Student's t-test). C: Theta peak frequency during DM in correct and incorrect trials for each animal. D: Normalized theta power (left) and theta peak frequency (right) as a function of speed during DM that preceded correct (green) or incorrect (red) choices. Data points represent mean ± SEM over trials across rats. [Color figure can be viewed in the online issue, which is available at wileyonlinelibrary.com.]