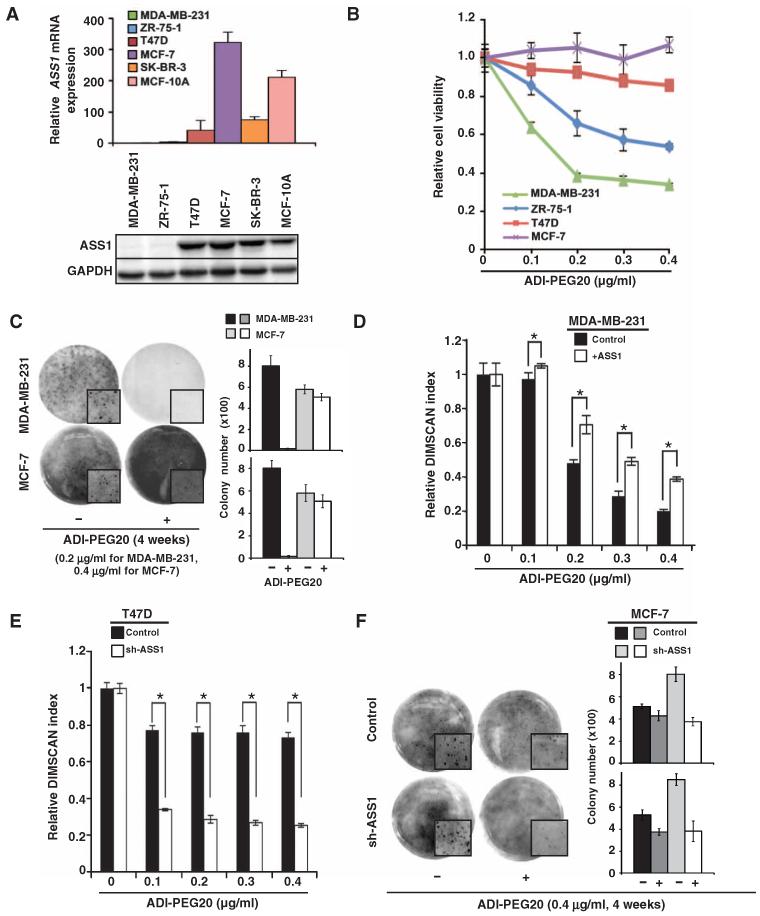
Fig. 1. Arginine starvation inhibits cell proliferation of ASS1-deficient breast cancer cells.
(A) ASS1 abundance varies in different breast cancer cell lines and immortalized MCF-10A cells. ASS1 mRNA abundance was analyzed by quantitative reverse transcription polymerase chain reaction (qRT-PCR; upper panel), and ASS1 protein abundance was assessed by Western blotting (lower panel). Glyceraldehyde-3-phosphate dehydrogenase (GAPDH) message or GAPDH protein abundance was used to normalize qRT-PCR results or to assure equal loading; n = 3 sets of cells. (B) Inverse correlation between ASS1 protein abundance and the cytotoxic effects of ADI-PEG20 on four breast cancer cell lines; n = 4 sets of cells. (C) Anchorage-independent growth of MDA-MB-231 cells is affected by ADI-PEG20 treatment; n = 2 sets of cells in triplicates (total 6). (D) Overexpression of ASS1 increases the IC50 (median inhibitory concentration) of ADI-PEG20 in MDA-MB-231 cells from 0.2 to 0.3 μg/ml; n = 3 sets of cells. (E) Knockdown of ASS1 abundance decreases IC50 of ADI-PEG20 in T47D cells (from greater than 0.4 to 0.075 μg/ml); n = 3 sets of cells. (F) Knockdown of ASS1 abundance sensitizes MCF-7 cells to ADI-PEG20 in colony formation assays; n = 2 sets of cells in triplicates (total 6). (C and F) Representative images show total colony area or a selected area of colony growth (enlarged; insets) on day 28. Bar graph representing means ± SD from individual set of three technical repeats is shown on the right. Viability and qRT-PCR data are shown as means ± SD; *P < 0.05.

