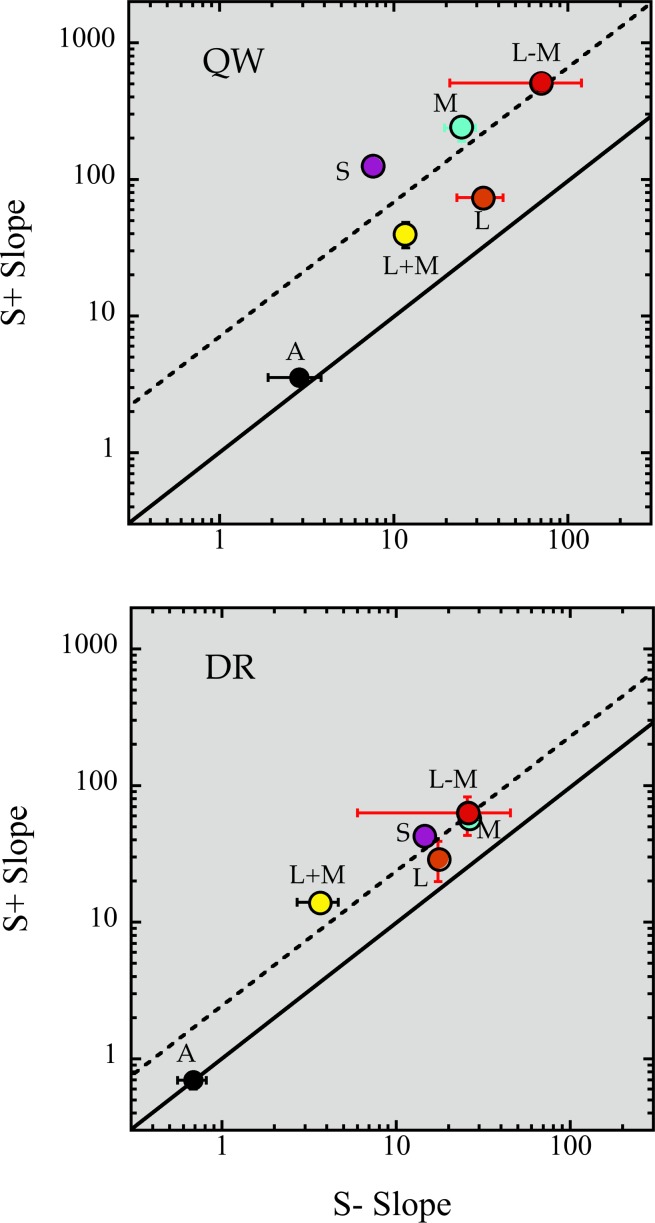
Figure 4.
Slope comparison of S+ and S− EvNs, on log-log coordinates, for two observers. The solid line shows equality of slopes. The dashed line shows the mean log difference (excluding the achromatic, L+M+S, slopes). Vertical and horizontal standard error bars are drawn when larger than the symbols. For both observers, the difference between S+ and S− slope is significantly greater than zero (paired t tests, p < 0.05), whether or not the achromatic slopes are included.

