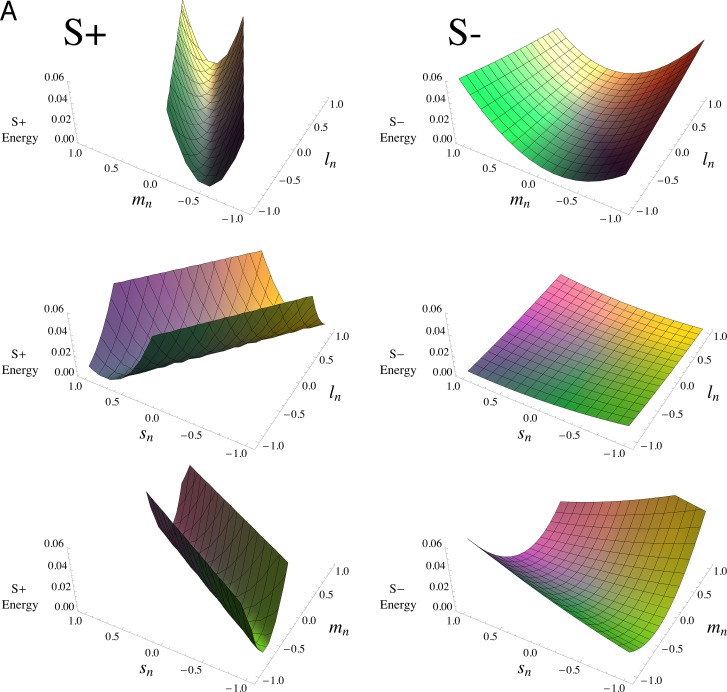
Figure 5.
Cone combination model. Plot of the linear mechanism model for noise masking (Equation 3), using the parameter values given in Table 2. Panel (A) is for QW; (B) is for DR. S+ tests are on the left, and S− tests are on the right; the three rows in each panel represent the effects of noises in the (L,M), (L,S), and (M,S) planes of cone contrasts, respectively. The scales are the same in each panel, with the surfaces truncated when they reach the top of the (invisible) bounding box containing the plot. The plots cover the full range of cone contrasts, to better illustrate the shapes of the model surfaces, rather than the more limited monitor gamut range. The surfaces have been colored to approximately represent the chromaticities of the noise (i.e., two points that are symmetric about the origin depict the two chromaticities of the binary noise).

