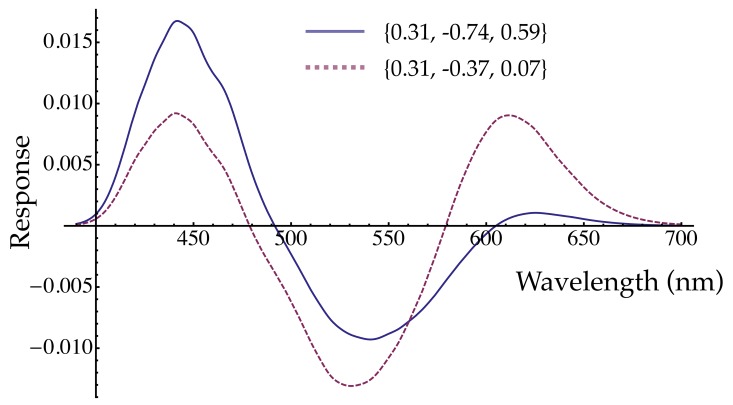
Figure 6.
Red-green valence functions. The solid line was calculated using the DR S+ weights from Table 2, assuming an equal energy “white” background and equal energy increment tests of the given wavelength (cf. Takahashi et al., 1985, who used a steady white background and briefly flashed monochromatic tests to which adaptation would be minimal or zero, as assumed here for the cone contrast calculations). The zero crossings are too long in wavelength to account for unique blue and unique yellow. For the dashed line, the M weight was halved and the S weight was divided by 8. These adjustments make the zero crossings near 479 and 579 nm.

