
Figure 3. Functional mapping of glutamate sensitivities in hippocampal neurons.
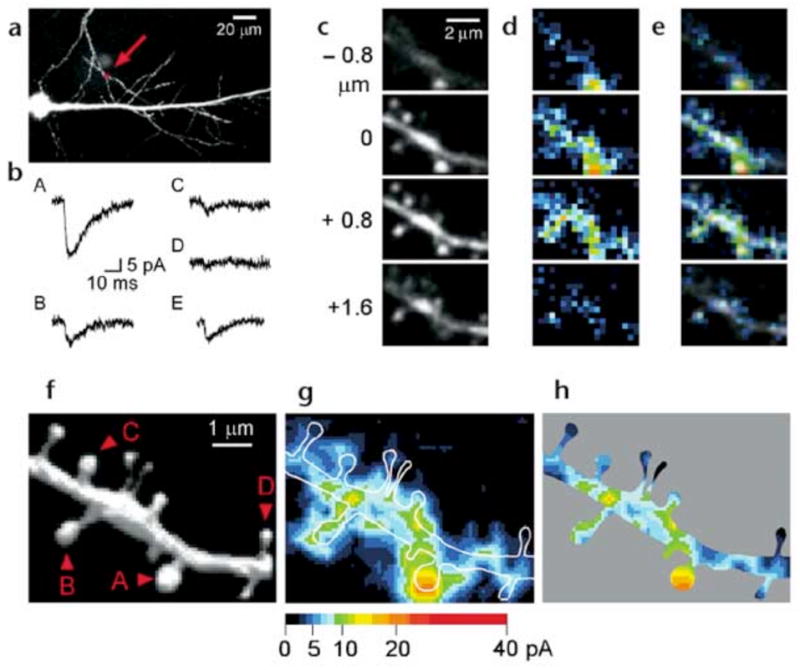
(a) Fluorescence image of a CA1 pyramidal neuron in slice. The arrow indicates the region of interest. (b) 2pEPSCs induced at four different sites of the dendrite indicated as A–D in (f). The traces were averages of data from four neighboring pixels. E shows an averaged trace of 10 mEPSCs recorded from the same neuron. (c–e) Fluorescence images at four z-axis sections as indicated (c), two-dimensional pseudocolor map of 2pEPSC amplitude (d), and overlays (e). (f) Three-dimensional reconstruction of the fluorescent images. (g) Maximal intensity plot of the glutamate sensitivity for the four sections shown in (d). The map has been smoothed by linear interpolation. White lines indicate contours of the dendritic structures. (h) Glutamate-sensitivity map within the dendritic contours.