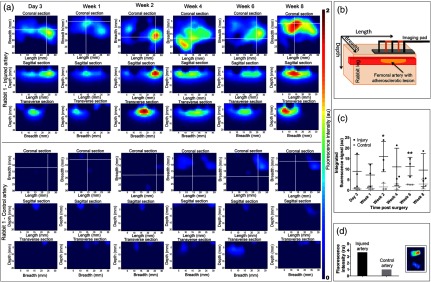
Fig. 2.

(a) Coronal (), sagittal and transverse sections of reconstructed fluorescence molecular tomography (FMT) signal from injured artery and corresponding control artery from a representative animal (rabbit 1). White lines indicate the position of the respective sagittal and transverse sections. (b) Schematic showing the relationship between the FMT images displayed to their orientation with respect to the tissue volume. (c) Time dependent changes in integrated fluorescence signal (, ) for injured and control arteries (*; **). (d) Mean () fluorescence intensity obtained from the ex vivo injured artery containing the lesion and the control artery. Adjoining figure (inset) shows the fluorescence images (excitation/emission: 785 nm/ >800 nm) of the injured artery containing the lesion (top) and the control artery (bottom).
