Figure 2.

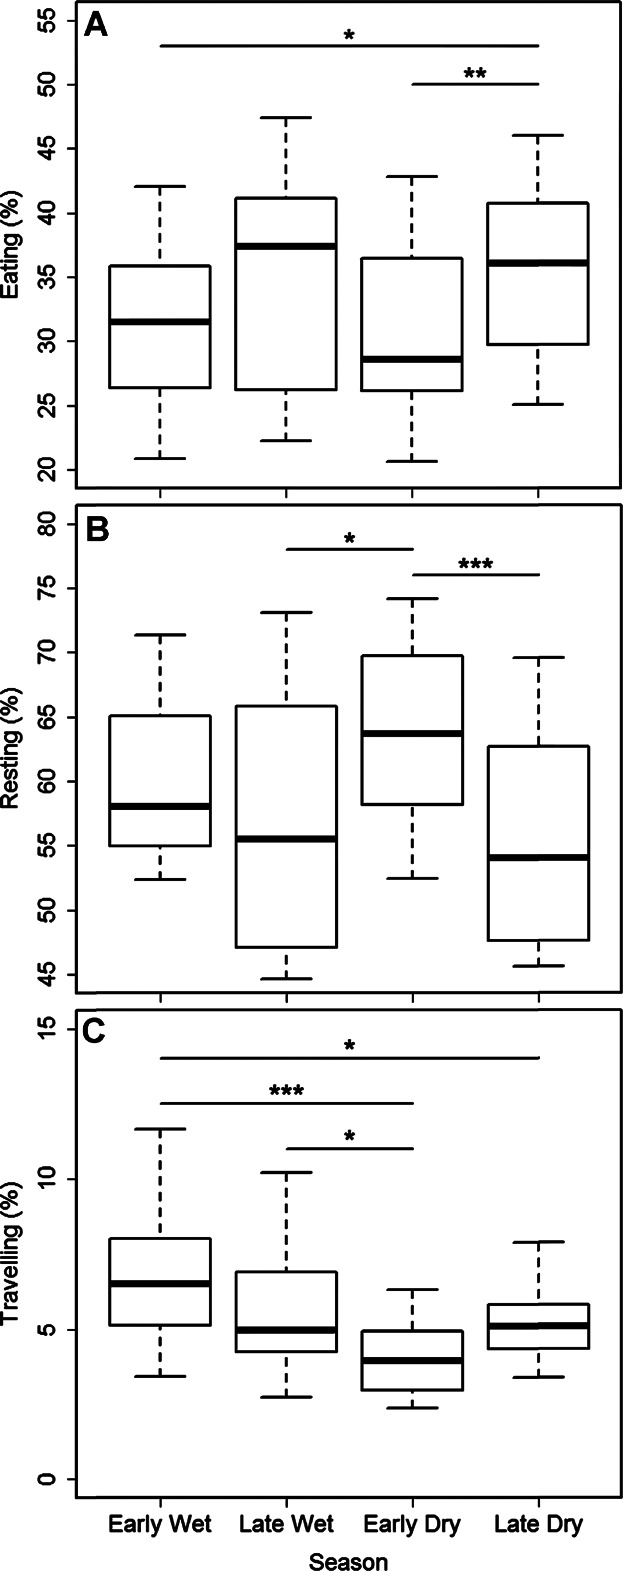
Boxplots showing medians and quartiles of the proportions of total observation time Lepilemur leucopus spent eating (A), resting (B) and traveling (C) across four seasons (N = 14; multilevel modeling (MLM) for repeated measures, *P < 0.05, **P < 0.01, ***P < 0.001).
