
Figure 2.
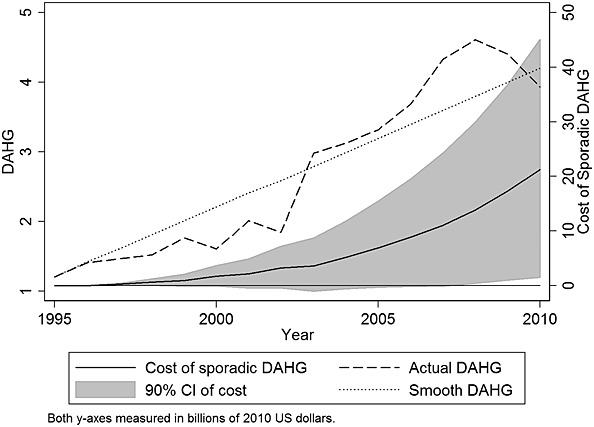
The cost of sporadic disbursement of DAHG between 1995 and 2010. This figure compares the effect of the actual scale-up of DAHG between 1995 and 2010 and a counterfactual. In the counterfactual scenario, the total amount of DAHG disbursed per country is set to be the total amount actually received, but disbursement is set to only increase over time (there are no DAHG reductions). The black solid line shows the cost of sporadically disbursed DAHG. Cost is defined as the difference between GHESmooth (caused by smooth DAHG disbursement) and GHEActual (caused by actual DAHG disbursement). The cost is positive and significant, showing that a smooth DAHG scale would have led to more total government health resources. The 90% CI is generated taking the 1,000 random draws from the estimated variance–covariance matrix