
Figure 3.
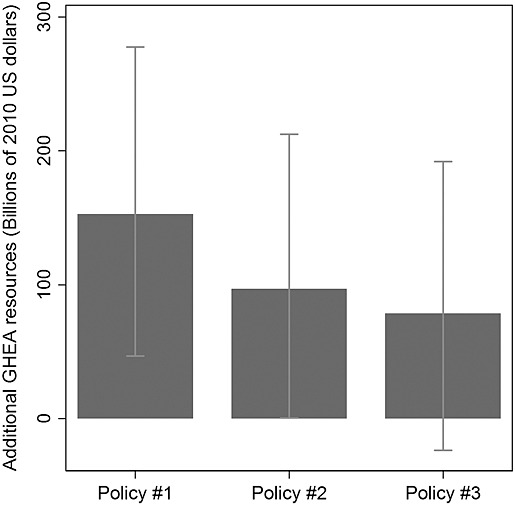
Policy options to limit effects of displacement. Between 1995 and 2010, $43.8 billion of DAHG was disbursed. This figure compares three possible policies that could have been used to insert more resources into the government health sector. Policy #1 is based on methods used to generate Figure 1 and assumes that recipient countries do not displace any DAHG. If policy #1 had been adopted between 1995 and 2010, $152.8 billion (CI: 46.9, 277.6) of GHEA would have been preserved. Policy #2 is based on methods used to generate Figure 2 and assumes that donor countries disburse DAHG at a non-decreasing rate. If policy #2 had been adopted between 1995 and 2010, $96.9 billion (CI: 0.5, 212.4) of GHEA would have been preserved. Policy #3 assumes that recipients displaced and replaced increases and decreases in DAHG at the same expected rate of displacement, where the expected rate of displacement is 1 − (GHE / GGE). If policy #3 had been adopted between 1995 and 2010, $78.6 billion (CI: −23.7, 192.1) of GHEA would have been preserved. Thin gray lines reflect the 90% CI.