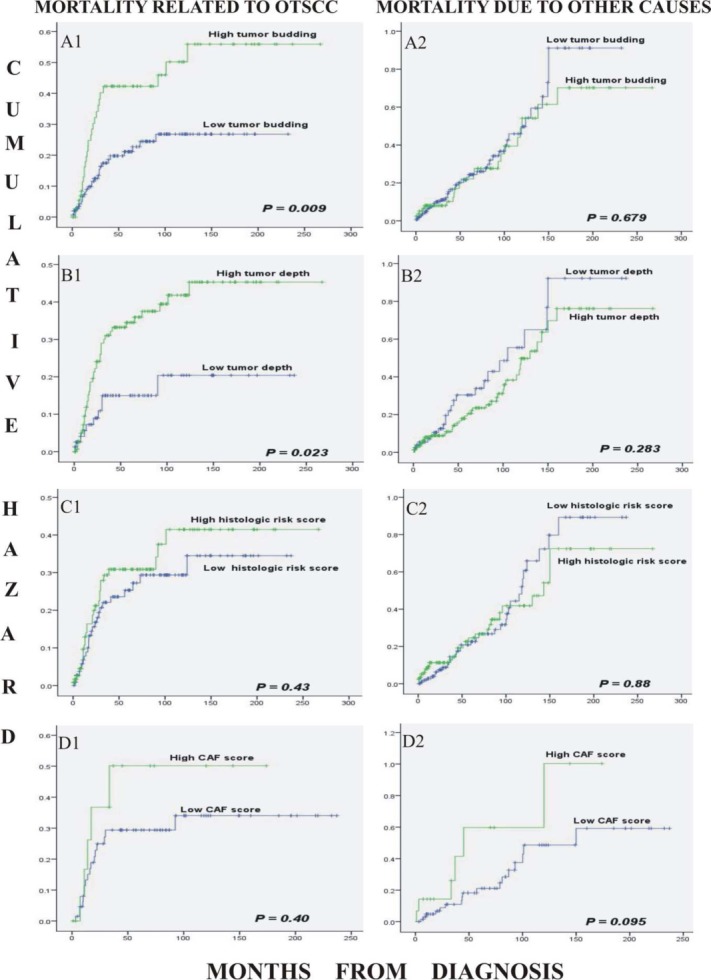
Figure 3.

Kaplan–Meier curves describing the cumulative mortality of patients during the follow-up period from oral tongue squamous cell carcinoma (A1–D1) and from other causes of death (A2–D2). The markers were tumor budding (high = ≥5 buds; low = <5 buds; A1, A2); tumor depth (high = ≥4 mm; low = <4 mm; B1, B2); histologic risk score (low = <3; high = ≥3; C1, C2); and cancer-associated fibroblast (CAF) score (high = high CAF density; low = medium and low CAF density; D1, D2). [Color figure can be viewed in the online issue, which is available at wileyonlinelibrary.com.]
