
Figure 4.
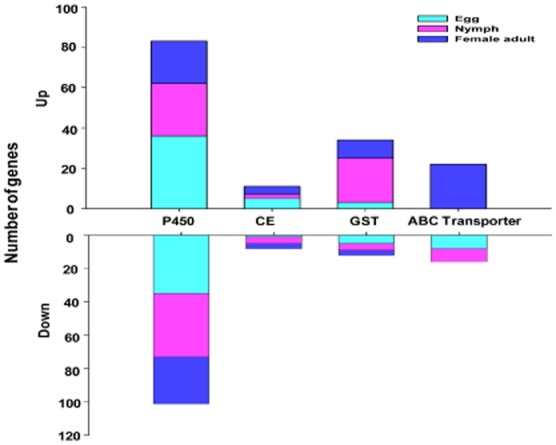
Expression profiles of expressed sequence tags encoding detoxification-related proteins in microarray analysis of a thiamethoxam resistant strain compared to a thiamethoxam susceptible strain. CE, carboxylesterase; GST, glutathione S-transferase; P450, cytochrome P450.