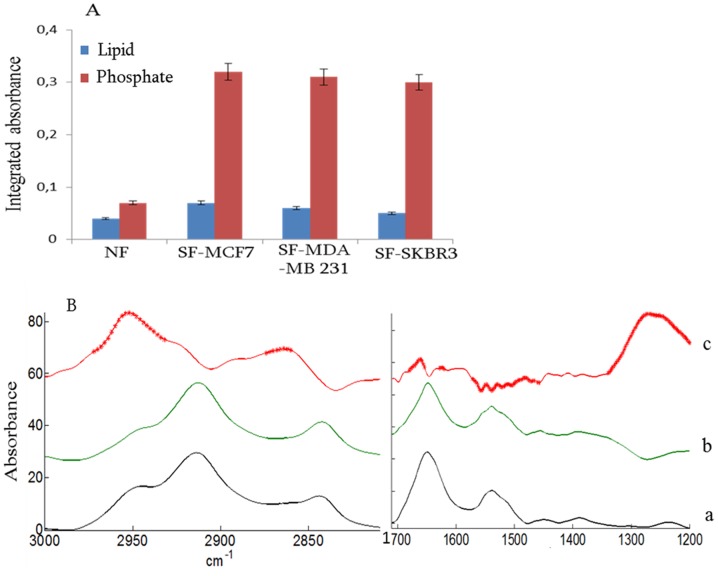
Figure 4. Comparison of lipid and phosphate changes observed in fibroblast grown alone (NF) or stimulated (SF) by cancer cell lines MCF-7, MDA-MB-231 and SKBR-3 (A.).
Error bars indicate plus or minus one standard deviation. (B) Mean spectra of fibroblasts grown alone (a) and stimulated by MCF-7 cells (b) and difference between the means (stimulated-normal) (c). A Student t-test was computed at every wavenumber with a significance level of α = 0.01% and a Bonferroni correction for multiple comparisons. Each red star indicates a statistically significant difference between the means.

