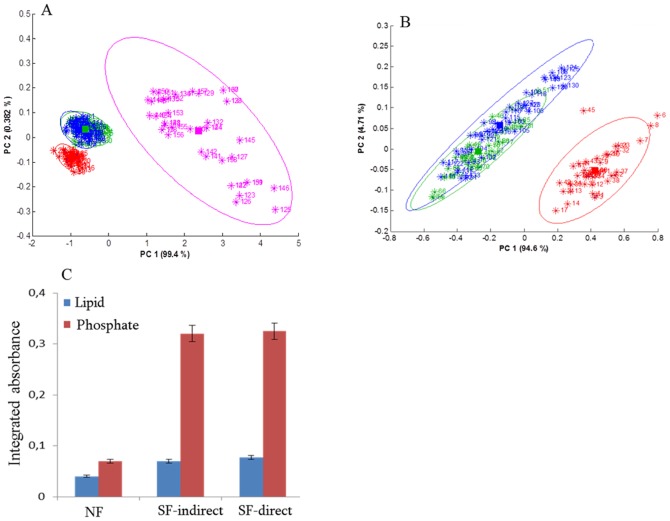
Figure 5. Evaluation of direct and no-contact interactions between fibroblasts and MCF-7 breast cancer cells (A) PCA score plot of spectra from normal (red), cancer stimulated with no direct contact (green) and with direct contact (blue) fibroblasts and of the MCF-7 (magenta).
The spectral region used for PCA was 1800–1485 cm−1. (B) PCA score plot of spectra from normal (red), cancer stimulated (MCF-7) in indirect contact (green) and direct contact (blue) with fibroblasts. Ellipses are drawn at 95% confidence interval. (C) Plot represents the lipid and phosphate changes observed in normal fibroblast (NF), cancer stimulated fibroblasts not in contact (SF indirect) or with direct contact (SF direct). Error bars indicate plus or minus one standard deviation.

