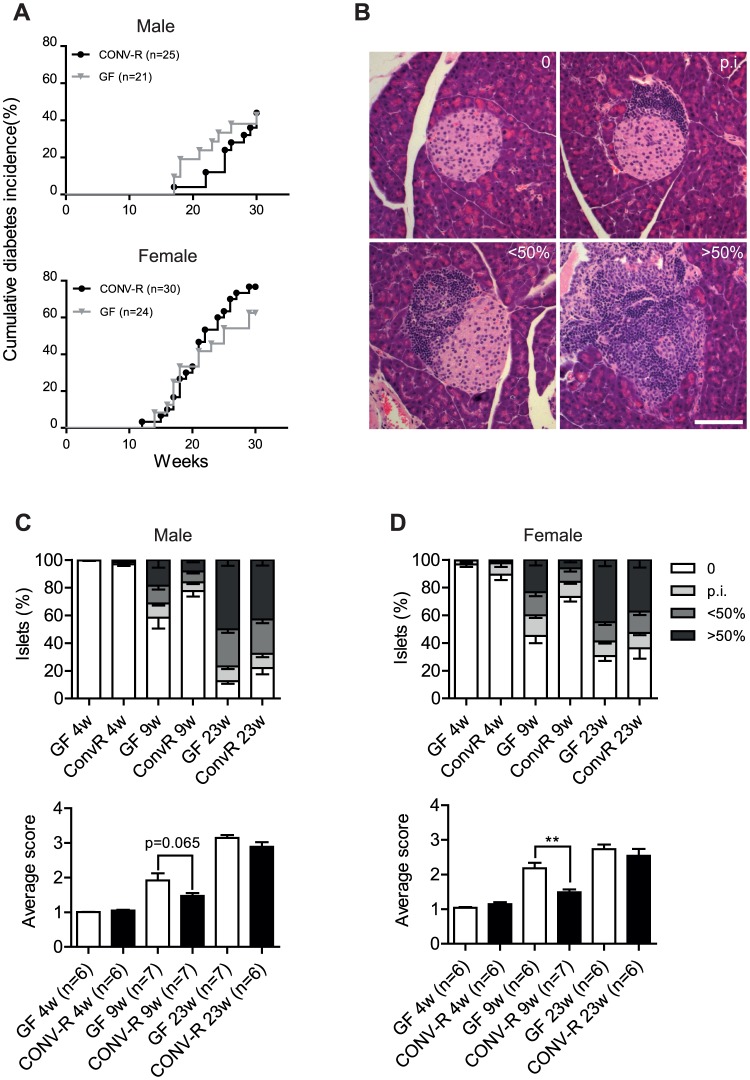
Figure 1. Diabetes incidence and insulitis in NOD mice.
(A) Cumulative diabetes incidence in male and female GF and CONV-R mice. (B) Representative images of islets in four insulitis categories: 0 (no infiltration); p.i. (peri-insulitis); <50% destruction; >50% destruction. Scale bar represents 100 µm. (C, D) Distribution of islet scores and average insulitis score in GF and CONVR male (C) and female (D) mice at 4, 9 and 23 weeks (n = 6–7). Data are presented as mean ± s.e.m. **p<0.01 determined by Student's t-test.

