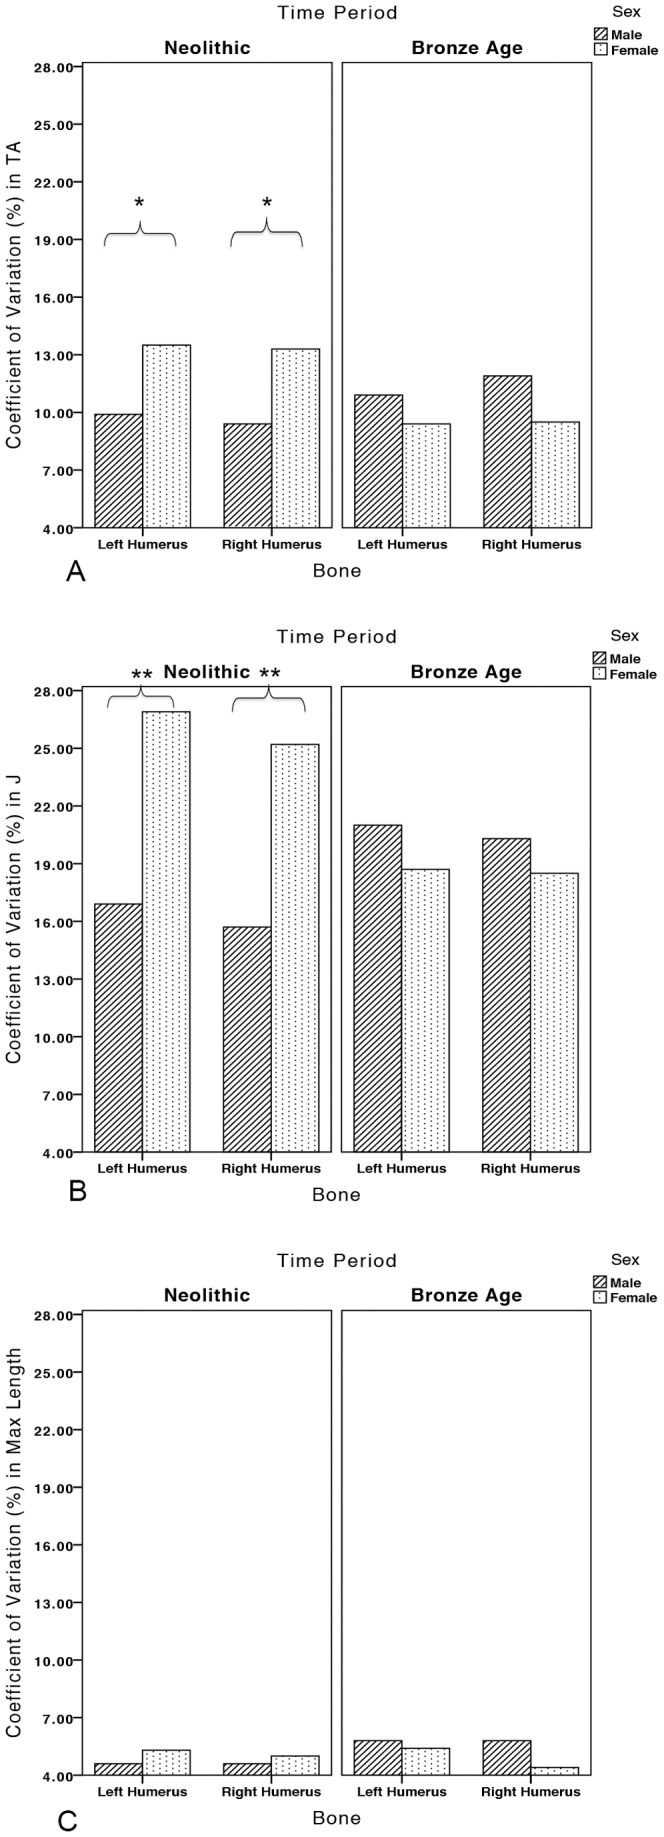
Figure 5. Coefficients of variation (%) in left and right humeral (A) TA, (B) J, and (C) maximum length in the Neolithic and Bronze Age periods by sex.

Brackets indicate significant differences (p<0.05 denoted by *; p<0.001 denoted by **).

Brackets indicate significant differences (p<0.05 denoted by *; p<0.001 denoted by **).