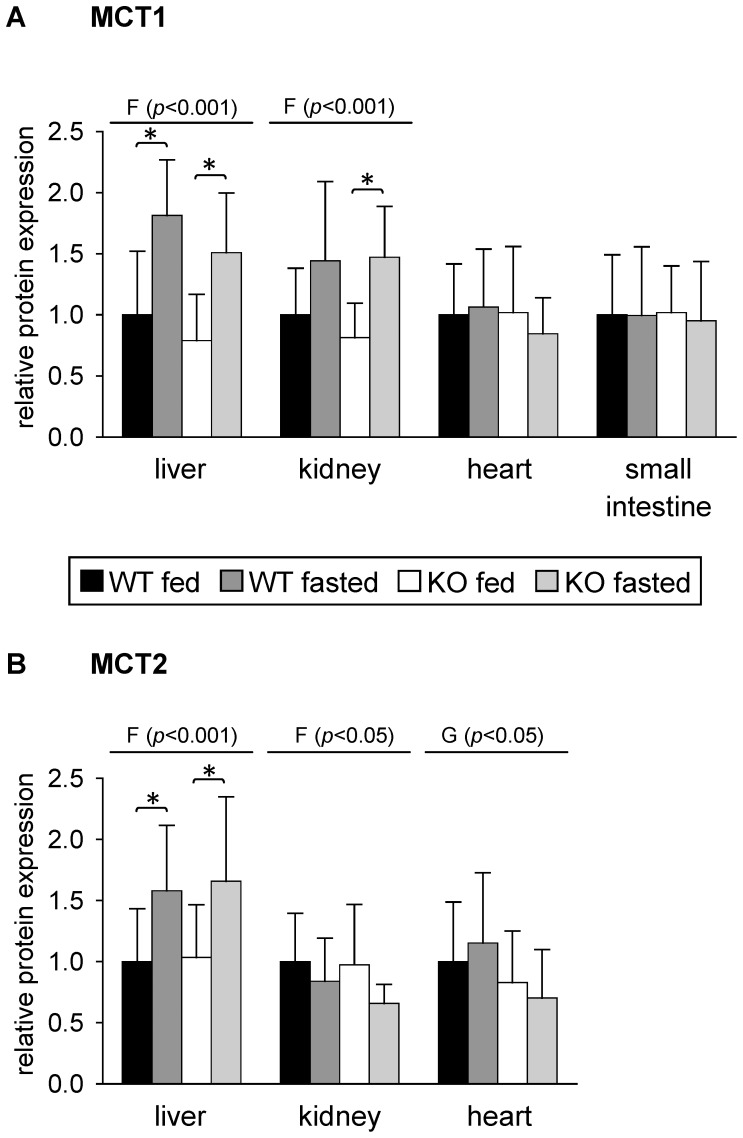
Figure 4. Relative protein expression of (A) monocarboxylate transporter (MCT)-1 and (B) MCT2 in mouse tissues in response to fasting and PPARα.
Values represent means ± SD of relative protein expression of wildtype (WT) and PPARα knockout (KO) mice that were fed ad libitum or fasted for 48 h (n = 16). Data were analyzed by two-way ANOVA. Classification factors were genotype, fasting, and the interaction between both factors. P-values revealed by two-way ANOVA are noted above the figures. Individual means of the treatment groups were compared by Tukey's test in case of variance homogeneity. In case of variance heterogeneity, as revealed by Levene's test, individual means were compared by Games Howell test. Horizontal brackets represent differences between groups in post-hoc comparison (*p<0.05).

