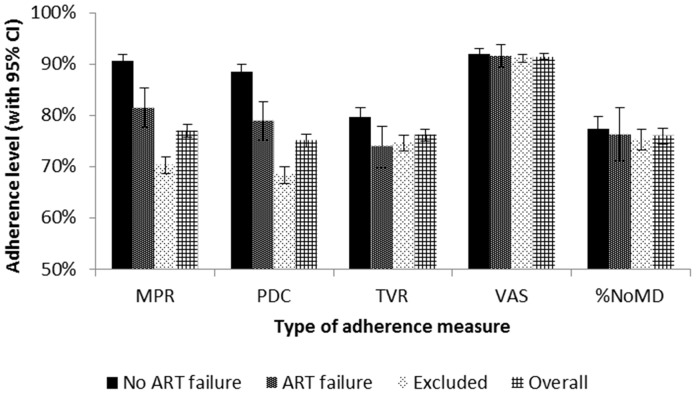
Figure 2. Baseline ART Adherence Levels (Months 1–6).
Pharmacy-based measures. MPR = Medication possession ratio; sample size: n = 2,458. PDC = Proportion of days covered; sample size: n = 2,458. TVR = Timely visit ratio; sample size: n = 2,242. Self-reported adherence measures. VAS = Visual analogue scale; sample size: n = 1,496. %NoMD = Proportion of visits with no missed dose reported; sample size: n = 1,505. Comparison groups. No ART failure (n = 727) and ART failure (n = 196) groups refer to patients in the primary analysis. Excluded group refers to patients excluded from the primary analysis (n = 1,587). Overall group refers to the full population of adult ART patients (n = 2,510).

