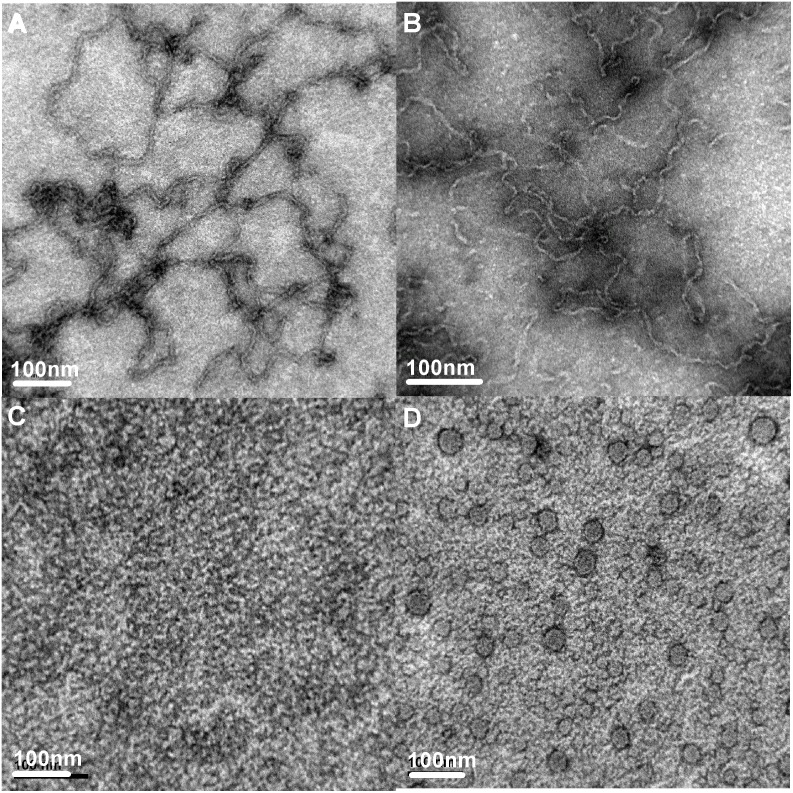
Figure 3. Representative negative staining transmission electron micrographs (TEM) of HγD-crys samples under different incubation conditions.
(A) HγD-crys incubated at pH 2.0, 37°C for 1 hr; (B) HγD-crys incubated at pH 2.0, 55°C for 1 hr; (C) HγD-crys incubated at pH 7.0, 37°C for 1 hr; and (D) HγD-crys incubated at pH 7.0, 55°C for 1 hr. Aggregation formed under pH 2.0 conditions resembles fibril morphology, while retaining granular appearance under pH 7.0 conditions. The scale bar represents 100 nm.

