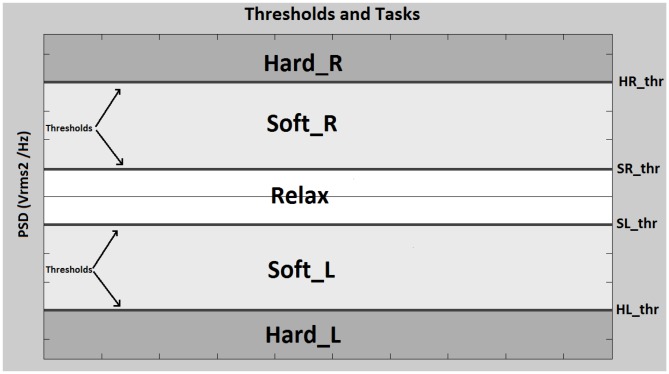
Figure 5. Thresholds and Tasks.
Horizontal lines represent the set of thresholds used as model to classify the processed signals. Each threshold represents a level of Power Spectral Density (PSD). Each value on X-axis represents one processed data window. Each data window is classified depending their position on the Y-axis (PSD). Each area delimited by the thresholds represents one of the 5 possible tasks.

